What Is The Relationship Between Concentration And Absorbance
Juapaving
Mar 26, 2025 · 5 min read
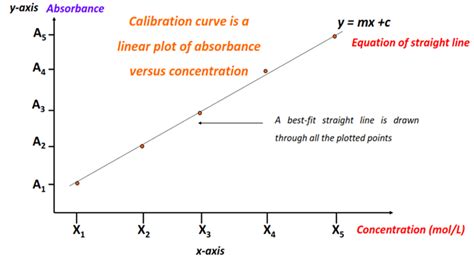
Table of Contents
What is the Relationship Between Concentration and Absorbance? Understanding Beer-Lambert Law
The relationship between concentration and absorbance is fundamental to many analytical techniques, particularly in spectrophotometry. Understanding this relationship is crucial for accurately quantifying substances in various fields, from chemistry and biochemistry to environmental science and medicine. This in-depth article will explore the Beer-Lambert Law, which describes this relationship, its limitations, and practical applications.
The Beer-Lambert Law: A Foundation of Spectrophotometry
The Beer-Lambert Law, also known as the Beer-Lambert-Bouguer Law, is an empirical relationship that describes the attenuation of light as it passes through a solution. It states that the absorbance of a solution is directly proportional to the concentration of the analyte and the path length of the light beam through the solution. Mathematically, this relationship is expressed as:
A = εbc
Where:
- A represents the absorbance of the solution (unitless). Absorbance is a logarithmic measure of the transmitted light intensity.
- ε represents the molar absorptivity (or molar extinction coefficient) of the analyte at a specific wavelength. This is a characteristic property of the substance and the wavelength of light used, expressed in units of L mol⁻¹ cm⁻¹.
- b represents the path length of the light beam through the solution, typically the width of the cuvette in centimeters (cm).
- c represents the concentration of the analyte, usually expressed in moles per liter (mol L⁻¹ or M).
Understanding Absorbance
Absorbance is not the same as transmittance. Transmittance (T) is the fraction of light that passes through the sample:
T = I/I₀
Where:
- I is the intensity of the light transmitted through the sample.
- I₀ is the intensity of the incident light.
Absorbance (A) is related to transmittance by the following equation:
A = -log₁₀T = -log₁₀(I/I₀)
This logarithmic relationship highlights the exponential nature of light attenuation as it interacts with the sample. A higher absorbance value indicates a greater degree of light absorption by the solution.
Understanding Molar Absorptivity (ε)
Molar absorptivity (ε) is a crucial parameter in the Beer-Lambert Law. It represents the ability of a substance to absorb light at a specific wavelength. A higher ε value signifies that the substance absorbs light more strongly at that wavelength. This value is specific to both the analyte and the wavelength of light used; it will change if you switch to a different wavelength. The units of molar absorptivity are typically L mol⁻¹ cm⁻¹, reflecting its dependence on concentration and path length.
Linearity and Deviations from the Beer-Lambert Law
The Beer-Lambert Law holds true under specific conditions. A linear relationship between absorbance and concentration is observed only within a certain concentration range. Deviations from linearity can occur due to several factors:
1. High Concentration Effects
At high concentrations, the analyte molecules may interact with each other, altering their ability to absorb light. This can lead to deviations from linearity, as the interactions between molecules affect the molar absorptivity. The molecules may effectively "shade" each other, reducing the overall absorbance.
2. Chemical Effects
Chemical changes in the analyte can also affect its absorbance. For instance, dissociation, association, or complex formation can alter the analyte's ability to absorb light at the chosen wavelength.
3. Stray Light
Stray light refers to light that reaches the detector without passing through the sample. This stray light can interfere with the measurement of absorbance, particularly at high absorbance values. Stray light adds to the measured transmitted light, leading to lower apparent absorbance values than expected.
4. Instrumental Factors
Instrumental factors, such as the stability of the light source and the accuracy of the detector, can also contribute to deviations from the Beer-Lambert Law. Any instability or inaccuracy in the instrument can introduce errors into the measurement.
5. Scattering
Scattering of light by particles in the solution can cause deviations from Beer-Lambert Law. This is particularly important for turbid or heterogeneous samples. The light is scattered in various directions, reducing the amount of light reaching the detector.
Applications of the Beer-Lambert Law
The Beer-Lambert Law has widespread applications in various fields, including:
1. Quantitative Analysis
The most common application is in quantitative analysis, where the concentration of an unknown analyte is determined by measuring its absorbance at a specific wavelength and using the Beer-Lambert Law to calculate its concentration. This is a cornerstone technique in many analytical chemistry methods.
2. Environmental Monitoring
The Beer-Lambert Law is used to measure pollutants in water and air samples. By analyzing the absorbance of specific substances, researchers and environmental agencies can determine the concentrations of pollutants and monitor environmental quality.
3. Clinical Diagnostics
In clinical diagnostics, spectrophotometry is used to measure various analytes in blood, serum, and other bodily fluids. This includes glucose, cholesterol, and enzymes. The Beer-Lambert Law provides a means to quantify these critical parameters for disease diagnosis and monitoring.
4. Food and Agricultural Science
The Beer-Lambert Law finds applications in food analysis for measuring the concentration of specific components, such as pigments or preservatives. It's also used in agriculture to analyze soil samples and determine nutrient concentrations.
Practical Considerations and Calibration Curves
To ensure accurate measurements, several practical considerations are crucial:
- Wavelength Selection: Choose a wavelength where the analyte exhibits maximum absorbance for optimal sensitivity and to minimize interference from other substances.
- Blanking: Use a blank sample (containing everything except the analyte) to calibrate the spectrophotometer and correct for background absorbance.
- Calibration Curve: Construct a calibration curve by plotting absorbance versus concentration for a series of standard solutions of known concentrations. This allows for accurate determination of unknown concentrations based on their measured absorbance. The calibration curve helps to identify any deviations from linearity and can provide a more accurate measure within the range of concentrations used for the calibration.
- Sample Preparation: Ensure the sample is homogenous, free of particulates, and appropriately diluted to fall within the linear range of the Beer-Lambert Law.
Conclusion
The Beer-Lambert Law provides a fundamental framework for understanding the relationship between concentration and absorbance. While the law holds true under ideal conditions, various factors can cause deviations. Understanding these limitations and employing appropriate techniques, such as calibration curves and careful sample preparation, is crucial for obtaining accurate and reliable results. Its wide range of applications in various fields underscores its importance in quantitative analysis and monitoring various substances in a wide array of samples. By mastering the principles and practical considerations of the Beer-Lambert Law, scientists and researchers can effectively utilize spectrophotometry for a wide range of applications.
Latest Posts
Latest Posts
-
The Si Unit Of Force Is
Mar 29, 2025
-
50 Out Of 60 As A Percentage
Mar 29, 2025
-
The Distance Around A Figure Is Called
Mar 29, 2025
-
Is Blood A Compound Or Mixture
Mar 29, 2025
-
What Can 17 Be Divided By
Mar 29, 2025
Related Post
Thank you for visiting our website which covers about What Is The Relationship Between Concentration And Absorbance . We hope the information provided has been useful to you. Feel free to contact us if you have any questions or need further assistance. See you next time and don't miss to bookmark.
