Vertical And Horizontal Lines On A Graph
Juapaving
Mar 18, 2025 · 6 min read
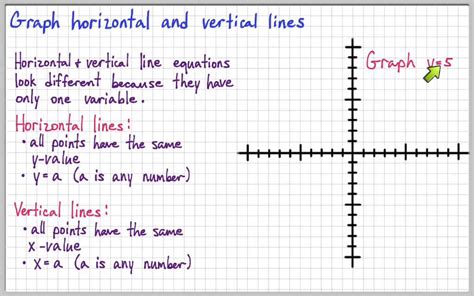
Table of Contents
Understanding Vertical and Horizontal Lines on a Graph: A Comprehensive Guide
Graphs are visual representations of data, providing a powerful way to understand relationships between variables. Within these graphical representations, vertical and horizontal lines play crucial roles in conveying information and highlighting key features of the data. This comprehensive guide delves into the significance of these lines, exploring their uses, interpretations, and applications across various fields.
What are Vertical and Horizontal Lines?
Before diving into their applications, let's establish a clear understanding of what constitutes a vertical and a horizontal line on a graph.
Vertical Lines: These lines run parallel to the y-axis, representing a constant value on the x-axis. They are perpendicular to the horizontal axis and extend infinitely upwards and downwards. Think of them as slices through the graph at a specific x-value.
Horizontal Lines: These lines run parallel to the x-axis, representing a constant value on the y-axis. They are perpendicular to the vertical axis and extend infinitely left and right. They show a consistent y-value across the entire range of the x-axis.
Interpreting Vertical and Horizontal Lines in Different Graph Types
The interpretation of vertical and horizontal lines varies depending on the type of graph being used. Let's explore some common graph types:
1. Cartesian Coordinate System (x-y graph)
In a standard Cartesian coordinate system, vertical lines indicate a specific x-value where all points on the line share the same x-coordinate. Similarly, horizontal lines represent a specific y-value where all points on the line share the same y-coordinate.
- Example: A vertical line at x = 5 represents all points with an x-coordinate of 5, regardless of their y-coordinate. A horizontal line at y = 2 represents all points with a y-coordinate of 2, regardless of their x-coordinate.
Understanding Intersections: The intersection point of a vertical and horizontal line uniquely defines a single point in the Cartesian plane. The x-coordinate is obtained from the vertical line, and the y-coordinate from the horizontal line.
2. Line Graphs
In line graphs, vertical and horizontal lines can be used to highlight specific data points or trends.
-
Vertical lines: Often used to show the value of a variable at a specific point in time or along another independent variable. For example, in a graph depicting stock prices over time, a vertical line could indicate the price at a specific date.
-
Horizontal lines: Can represent target values or averages. A horizontal line showing an average value helps visualize how data points deviate from the mean.
3. Bar Charts and Histograms
While less prevalent, vertical and horizontal lines can also enhance bar charts and histograms.
-
Vertical lines: Used to emphasize specific bars or groups of bars, separating them visually or highlighting a particular data point.
-
Horizontal lines: In histograms, horizontal lines might represent frequency thresholds or significant data boundaries.
4. Scatter Plots
In scatter plots, where data points are plotted based on two variables, vertical and horizontal lines are less commonly used for direct interpretation. However, they might be employed to create visual boundaries or highlight regions of interest within the data cloud.
- Example: A vertical line might separate high and low values of the independent variable, while a horizontal line could separate high and low values of the dependent variable.
Applications of Vertical and Horizontal Lines
Vertical and horizontal lines find applications in numerous fields:
1. Mathematics: Functions and Asymptotes
-
Functions: Vertical lines play a crucial role in determining whether a relation is a function. The vertical line test states that if any vertical line intersects the graph of a relation more than once, the relation is not a function.
-
Asymptotes: In calculus, vertical and horizontal asymptotes describe the behavior of a function as it approaches infinity or a specific value. Vertical asymptotes often occur where the function is undefined, while horizontal asymptotes indicate the limiting value of the function as x approaches positive or negative infinity.
2. Physics: Graphs of Motion
In physics, graphs of motion often use vertical and horizontal lines to represent various aspects of movement.
-
Displacement-time graphs: Horizontal lines represent periods of zero velocity (no change in displacement over time). Vertical lines are less common but could indicate an instantaneous jump in position.
-
Velocity-time graphs: Horizontal lines represent constant velocity. The area under the curve (a series of horizontal lines) represents the displacement. Vertical lines are generally not used in a conventional velocity-time graph.
3. Economics: Supply and Demand Curves
In economics, supply and demand curves utilize vertical and horizontal lines to define equilibrium points.
- Supply and Demand Curves: The intersection of the supply and demand curves signifies the market equilibrium price and quantity. Horizontal lines can represent price ceilings or floors. Vertical lines may less frequently be used to represent quantity limitations.
4. Statistics: Box Plots
In box plots, which display the distribution of data, horizontal lines represent important statistical measures like the median, quartiles, and range. Vertical lines are often used to visually separate individual box plots in a comparative analysis.
Advanced Concepts and Interpretations
Let's delve deeper into some more advanced concepts involving vertical and horizontal lines:
1. Interpreting Slopes and Rates of Change
In a linear function represented graphically, the slope of the line determines the rate of change between the dependent and independent variables. However, vertical and horizontal lines have special cases regarding slope.
-
Horizontal Lines: Horizontal lines have a slope of zero. This indicates no change in the dependent variable with respect to the independent variable.
-
Vertical Lines: Vertical lines have an undefined slope. This is because the change in x is zero, resulting in division by zero in the slope calculation.
2. Data Visualization and Interpretation using Lines
Effective use of vertical and horizontal lines enhances data visualization and interpretation:
-
Highlighting Key Data Points: Lines can draw attention to crucial data points, averages, or trends within the data set.
-
Creating Visual Separations: Lines effectively separate sections of the graph, improving the clarity of data comparison.
-
Improving Readability: Strategic use of lines improves the overall readability and comprehension of the graph.
3. Limitations of Vertical and Horizontal Lines
While useful, it is crucial to understand the limitations of using vertical and horizontal lines:
-
Oversimplification: Using lines might oversimplify complex relationships in the data.
-
Misinterpretation: Lines can be misinterpreted if not clearly labeled and explained within the context of the graph.
-
Limited Scope: Lines cannot capture the full complexity of nonlinear relationships.
Conclusion: Mastering the Power of Vertical and Horizontal Lines
Understanding vertical and horizontal lines is fundamental to interpreting graphical data accurately and effectively. Their applications are diverse, spanning mathematics, physics, economics, and various other fields. By mastering the interpretation and application of these lines, one gains a powerful tool for visualizing, analyzing, and communicating insights from data, paving the way for a deeper understanding of the underlying relationships. Remember, careful consideration of context, appropriate labeling, and a clear understanding of the limitations are crucial for extracting meaningful information from graphs that utilize vertical and horizontal lines. The effective use of these lines, combined with other graphical elements, enhances data visualization and communication, making complex data more accessible and understandable.
Latest Posts
Latest Posts
-
What Are All Of The Factors Of 81
Mar 18, 2025
-
Write 44 As A Product Of Prime Factors
Mar 18, 2025
-
What Is The Electron Configuration For I
Mar 18, 2025
-
How Many Chambers In A Frog Heart
Mar 18, 2025
-
How Many Protons Neutrons And Electrons In Sodium
Mar 18, 2025
Related Post
Thank you for visiting our website which covers about Vertical And Horizontal Lines On A Graph . We hope the information provided has been useful to you. Feel free to contact us if you have any questions or need further assistance. See you next time and don't miss to bookmark.
