What Is The Difference Between Percentile And Percent
Juapaving
Mar 19, 2025 · 5 min read
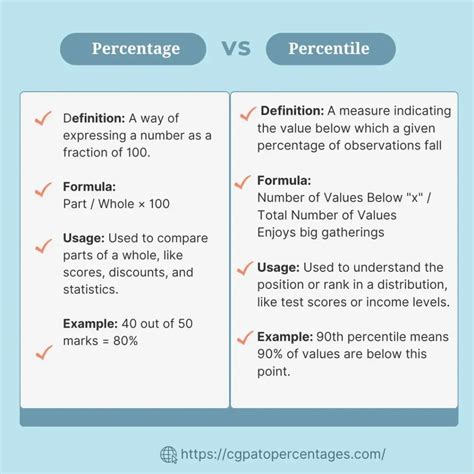
Table of Contents
What's the Difference Between Percentile and Percent?
Understanding the difference between percentiles and percentages is crucial for anyone working with data analysis, statistics, or standardized test scores. While both involve expressing a portion of a whole, they represent that portion in fundamentally different ways. This article will thoroughly dissect the distinction, providing clear examples and practical applications to ensure a comprehensive understanding.
Percentages: Parts of a Whole
A percentage represents a fraction of 100. It expresses the proportion of something relative to the total. The word "percent" literally means "out of 100." For example, 75% means 75 out of 100, or 75/100, which simplifies to ¾.
Key Characteristics of Percentages:
- Relative to the Total: Percentages always relate a part to the whole. A percentage on its own doesn't convey absolute value; it requires context. Saying "20% of students passed" is meaningful only if you know the total number of students.
- Simple Calculation: Calculating a percentage is straightforward: (Part / Whole) * 100 = Percentage.
- Wide Applicability: Percentages are used universally to represent proportions in various fields, from finance (interest rates) to demographics (population percentages) to academic performance (grades).
- Constant Meaning: The meaning of a percentage remains consistent regardless of the dataset size. 20% always means 20 out of 100, whether referring to 100 apples or 1000 apples.
Example:
If 30 out of 50 students passed an exam, the percentage of students who passed is (30/50) * 100 = 60%. This means 60 out of every 100 students (hypothetically) would pass based on this data.
Percentiles: Ranking Within a Dataset
A percentile, unlike a percentage, indicates the value below which a certain percentage of observations in a group of observations falls. It's a measure of relative standing within a distribution of data. The 80th percentile, for example, is the value below which 80% of the data points lie.
Key Characteristics of Percentiles:
- Relative Ranking: Percentiles describe the position of a data point within a sorted dataset. They don't directly express a fraction of the total like percentages.
- Dependent on Dataset: The meaning of a percentile is highly dependent on the specific dataset being considered. The 90th percentile of exam scores in one class might be different from the 90th percentile in another class.
- More Complex Calculation: Calculating percentiles involves sorting the data and then identifying the value at a specific rank. There are several methods for calculating percentiles (linear interpolation being a common one), leading to slight variations in results depending on the method used.
- Used for Comparative Analysis: Percentiles are incredibly useful for comparing individuals or items within a group. For instance, knowing a student scored at the 95th percentile on a standardized test indicates their performance relative to other test-takers.
Example:
Suppose we have the following set of exam scores: {60, 70, 75, 80, 85, 90, 95, 100}. To find the 75th percentile, we first sort the data (which it already is). There are 8 scores. The rank for the 75th percentile is (75/100) * 8 = 6. This means the 75th percentile score is the 6th value in the sorted list, which is 90. This means 75% of the students scored 90 or below.
Key Differences Summarized
| Feature | Percentage | Percentile |
|---|---|---|
| Meaning | Part of a whole (out of 100) | Value below which a certain percentage lies |
| Calculation | Simple: (Part / Whole) * 100 | More complex, involves ranking and interpolation |
| Dataset Dependence | Independent of dataset size | Highly dependent on the specific dataset |
| Interpretation | Relative proportion | Relative position within a distribution |
| Application | Diverse applications (finance, demographics) | Comparing individual performance/values |
Practical Applications and Examples
Let's explore several real-world examples to further solidify the distinction:
1. Standardized Testing:
- Percentage: A student might score 85% on a math test. This means they answered 85 out of 100 questions correctly.
- Percentile: The same student might be in the 90th percentile nationally. This means their score is higher than 90% of all students who took the test nationally.
2. Income Distribution:
- Percentage: The top 1% of earners might control 20% of the national income. This shows the proportion of income controlled by a specific group.
- Percentile: An individual's income might fall at the 70th percentile. This shows their income relative to other incomes in the population.
3. Height and Weight:
- Percentage: A child might be in the 75th percentile for height. This means that 75% of children their age are shorter than them. This isn’t a percentage, it is a percentile.
- Percentage: A specific height could represent a certain percentage of the overall population. For example, 20% of adults might be taller than 6 feet.
4. Investment Returns:
- Percentage: An investment might yield a 10% return. This signifies the increase in value relative to the initial investment.
- Percentile: An investment fund's performance could be compared to others, and it might be in the 80th percentile among similar funds, indicating its relative performance.
5. Weather Reports:
- Percentage: A weather forecast might predict a 70% chance of rain. This expresses the probability of rain occurring.
- Percentile: Rainfall amounts can be expressed using percentiles to show how a given year's rainfall compares historically. For instance, a year with rainfall in the 95th percentile experienced unusually high rainfall.
Common Misconceptions
A frequent misunderstanding is interchanging percentiles and percentages. Remember:
- A percentile is a value, while a percentage is a proportion.
- A percentile rank describes a position, whereas a percentage describes a part of a whole.
Failing to distinguish between them can lead to misinterpretations and inaccurate conclusions when analyzing data.
Conclusion: Choosing the Right Measure
Both percentages and percentiles are valuable tools for data analysis, but they serve different purposes. Percentages express proportions, while percentiles express ranks within a dataset. Understanding their distinctions is critical for accurately interpreting data and communicating findings effectively. Choosing the right measure depends entirely on the context and what aspect of the data you wish to emphasize – the relative proportion or the relative ranking.
Latest Posts
Latest Posts
-
Three Main Parts Of A Nucleotide
Mar 19, 2025
-
Which Terms Are Used To Identify Pure Substances
Mar 19, 2025
-
Which Of The Following Produce Antibodies
Mar 19, 2025
-
Least Common Multiple Of 6 5 And 7
Mar 19, 2025
-
What Is The Lcm Of 6 And 10
Mar 19, 2025
Related Post
Thank you for visiting our website which covers about What Is The Difference Between Percentile And Percent . We hope the information provided has been useful to you. Feel free to contact us if you have any questions or need further assistance. See you next time and don't miss to bookmark.
