The Demand Curve Of A Monopolist Is
Juapaving
Mar 07, 2025 · 6 min read
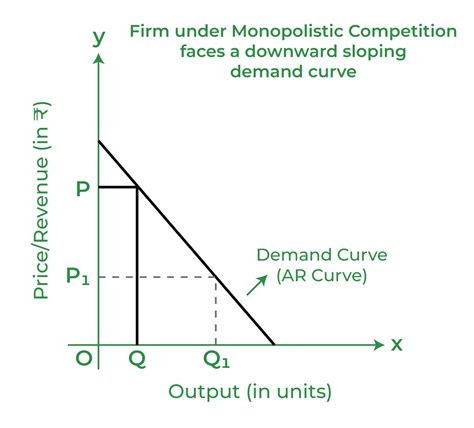
Table of Contents
The Demand Curve of a Monopolist: A Deep Dive
The demand curve facing a monopolist is fundamentally different from that of a firm operating in a perfectly competitive market. Understanding this difference is crucial to grasping the unique pricing and output decisions a monopolist makes. This article will explore the demand curve of a monopolist, explaining its downward slope, the relationship between price and quantity, and how this impacts the monopolist's profit maximization strategy. We'll delve into the key distinctions compared to competitive markets and analyze the implications for consumers and the overall economy.
The Downward-Sloping Demand Curve: A Defining Characteristic
Unlike a perfectly competitive firm, which faces a perfectly elastic (horizontal) demand curve, a monopolist confronts a downward-sloping demand curve. This is because the monopolist is the sole supplier of a particular good or service with no close substitutes. This means the monopolist controls the market price. To sell more units, the monopolist must lower the price, not just for the additional units but for all units sold. This is a key distinction; a competitive firm can sell as much as it wants at the market price, but a monopolist must actively manage the price-quantity relationship.
Understanding the Inverse Relationship
The downward slope illustrates the inverse relationship between price and quantity demanded. As the price falls, the quantity demanded rises. This is due to several factors:
- Increased Consumer Purchasing Power: Lower prices make the good or service more affordable for a wider range of consumers, leading to increased demand.
- Substitution Effect: Even without perfect substitutes, lower prices make the monopolist's product relatively more attractive compared to alternative uses of consumer income.
- Increased Market Penetration: Lower prices can attract new consumers who were previously unwilling to purchase the product at a higher price.
This downward-sloping demand curve isn't unique to monopolies; oligopolies and monopolistically competitive firms also face downward-sloping demand curves. However, the degree of slope differs significantly depending on the market structure and the availability of substitutes.
The Monopolist's Demand Curve vs. the Market Demand Curve
It's crucial to differentiate between the monopolist's demand curve and the overall market demand curve. The market demand curve shows the total quantity demanded by all consumers at various price points. The monopolist's demand curve is the market demand curve. This is because the monopolist is the entire market. There are no other firms selling the same product. This gives the monopolist significant power in setting prices.
Implications for Pricing Decisions
The fact that the monopolist's demand curve is the market demand curve profoundly impacts its pricing decisions. The monopolist can't simply choose a quantity and let the market determine the price, as a competitive firm can. Instead, the monopolist must carefully consider the trade-off between price and quantity. Higher prices mean higher revenue per unit, but fewer units sold. Conversely, lower prices mean more units sold, but lower revenue per unit.
Marginal Revenue and the Monopolist's Demand Curve
A further crucial concept is marginal revenue (MR). Marginal revenue is the additional revenue generated by selling one more unit. For a monopolist, marginal revenue is always less than the price. This is a direct consequence of the downward-sloping demand curve. To sell one more unit, the monopolist must lower the price on all units, not just the additional one. This price reduction reduces revenue on the previously sold units, making the marginal revenue less than the price of the additional unit.
The Relationship Between MR and Demand
The relationship between marginal revenue and the demand curve is illustrated graphically. The marginal revenue curve always lies below the demand curve, and it typically falls at twice the rate of the demand curve. This means that as the quantity sold increases, marginal revenue decreases more quickly than the price.
Profit Maximization: Where MR = MC
The monopolist, like any profit-maximizing firm, seeks to produce the quantity where marginal revenue (MR) equals marginal cost (MC). This is the same principle that applies to competitive firms, but the context is vastly different. For a competitive firm, MR equals the price, but for a monopolist, MR is less than the price.
Once the monopolist identifies the profit-maximizing quantity (where MR=MC), it can then use its demand curve to determine the corresponding price. This price will be higher than the marginal cost and significantly higher than the price that would prevail in a perfectly competitive market.
Welfare Implications of Monopoly Power
The monopolist's ability to control price and quantity has significant welfare implications. Compared to a perfectly competitive market, a monopoly generally leads to:
- Higher Prices: Monopolists charge higher prices than competitive firms, reducing consumer surplus (the difference between what consumers are willing to pay and what they actually pay).
- Lower Output: Monopolists produce a lower quantity of output than would be produced in a competitive market, leading to deadweight loss (the loss of economic efficiency that can occur when equilibrium for a good or service is not Pareto optimal).
- Reduced Consumer Choice: The absence of competition can stifle innovation and reduce consumer choice. The monopolist may not feel pressure to offer diverse products or improve quality as a competitive firm would.
- Potential for Rent-Seeking Behavior: Monopolists might engage in rent-seeking activities, such as lobbying for regulations that protect their market position, further reducing overall economic efficiency.
Government Regulation and Monopoly Control
Given the potential for welfare losses associated with monopolies, governments often intervene to regulate their behavior. This intervention can take various forms:
- Antitrust Laws: Laws designed to prevent monopolies from forming or engaging in anti-competitive practices.
- Price Controls: Setting maximum prices that a monopolist can charge. However, this requires careful consideration to avoid unintended consequences like shortages.
- Public Ownership: In some cases, the government may take over ownership and operation of a monopoly to ensure efficiency and equitable pricing.
- Deregulation: In some sectors, deregulation aims to increase competition and reduce monopoly power.
Examples of Monopolies and Their Demand Curves
While true monopolies are relatively rare in the modern economy, several industries exhibit monopolistic characteristics. Examples include:
- Utility Companies (water, electricity): Often granted exclusive rights to provide services within a geographic area. Their demand curves reflect the localized demand within their service territory.
- Pharmaceutical Companies with Patented Drugs: During the patent period, a pharmaceutical company has exclusive rights to sell a particular drug, giving them significant pricing power. The demand curve reflects the demand for that specific drug.
- Software Companies with Dominant Market Share: Companies that control a significant portion of a software market can exert substantial pricing power, influencing their demand curves.
Conclusion: The Power and Perils of the Monopolist's Demand Curve
The downward-sloping demand curve of a monopolist is a defining feature of its market power. This power allows the monopolist to set prices higher and produce less output than would occur under perfect competition. Understanding this unique demand curve, along with its implications for pricing, output, and welfare, is vital for analyzing the behavior and impact of monopolies in the economy. While monopolies can offer advantages such as economies of scale and technological innovation, the potential for welfare losses requires ongoing vigilance and appropriate regulatory measures to mitigate the negative consequences. The demand curve of the monopolist remains a critical concept in microeconomics, emphasizing the trade-offs between market power and economic efficiency.
Latest Posts
Latest Posts
-
Which Is A Characteristic Of A Mixture
Mar 09, 2025
-
What Is The Highest Common Factor Of 28 And 42
Mar 09, 2025
-
The Matrix Of Blood Is Called
Mar 09, 2025
-
The Rate Of Change In Velocity Is Called
Mar 09, 2025
-
Do Plant Cells Have A Mitochondria
Mar 09, 2025
Related Post
Thank you for visiting our website which covers about The Demand Curve Of A Monopolist Is . We hope the information provided has been useful to you. Feel free to contact us if you have any questions or need further assistance. See you next time and don't miss to bookmark.
