Standard Deviation And Relative Standard Deviation
Juapaving
Mar 16, 2025 · 6 min read
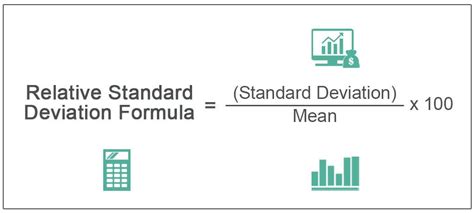
Table of Contents
Understanding Standard Deviation and Relative Standard Deviation: A Comprehensive Guide
Standard deviation and relative standard deviation are fundamental statistical concepts used to quantify the dispersion or spread of a dataset. They are crucial tools in various fields, from finance and engineering to healthcare and social sciences, providing valuable insights into data variability. This comprehensive guide will delve into the meaning, calculation, interpretation, and applications of both standard deviation and relative standard deviation.
What is Standard Deviation?
Standard deviation (SD) measures the amount of variation or dispersion of a set of values. A low standard deviation indicates that the values tend to be close to the mean (average) of the set, while a high standard deviation indicates that the values are spread out over a wider range. Essentially, it tells us how much individual data points deviate from the average.
Think of it this way: Imagine two archery teams shooting at a target. Team A's arrows are clustered tightly around the bullseye, indicating a low standard deviation. Team B's arrows are scattered widely across the target, indicating a high standard deviation. Both teams might have the same average score, but the consistency (or lack thereof) is clearly different, a difference reflected in their standard deviations.
Calculating Standard Deviation: A Step-by-Step Guide
Calculating the standard deviation involves several steps:
-
Calculate the mean (average): Sum all the values in your dataset and divide by the number of values.
-
Find the differences from the mean: Subtract the mean from each individual value. These are your deviations from the mean.
-
Square the differences: Square each of the deviations calculated in step 2. This eliminates negative values and emphasizes larger deviations.
-
Find the average of the squared differences: Sum the squared differences and divide by the number of values (n) minus 1 (for sample standard deviation, denoted as s) or by the number of values (n) (for population standard deviation, denoted as σ). Dividing by (n-1) provides an unbiased estimate of the population standard deviation when working with a sample.
-
Take the square root: The square root of the average of the squared differences is the standard deviation.
Formula for Sample Standard Deviation (s):
s = √[Σ(xᵢ - x̄)² / (n - 1)]
Where:
- xᵢ represents each individual value in the dataset.
- x̄ represents the mean of the dataset.
- n represents the number of values in the dataset.
- Σ represents the summation.
Formula for Population Standard Deviation (σ):
σ = √[Σ(xᵢ - μ)² / n]
Where:
- μ represents the population mean.
Interpreting Standard Deviation
The magnitude of the standard deviation provides insights into the data's variability:
-
Small Standard Deviation: Indicates that the data points are clustered closely around the mean, suggesting low variability and high consistency.
-
Large Standard Deviation: Indicates that the data points are spread far from the mean, suggesting high variability and low consistency.
What is Relative Standard Deviation (RSD)?
Relative standard deviation (RSD), also known as the coefficient of variation (CV), expresses the standard deviation as a percentage of the mean. It provides a standardized measure of variability, making it easier to compare the dispersion of datasets with different means and units. This is particularly useful when comparing datasets with significantly different scales or units.
Calculating Relative Standard Deviation
The calculation is straightforward:
RSD = (Standard Deviation / Mean) x 100%
For example, if a dataset has a standard deviation of 5 and a mean of 50, the RSD would be (5/50) x 100% = 10%.
Interpreting Relative Standard Deviation
RSD allows for a more direct comparison of variability between datasets:
-
Low RSD: Indicates that the standard deviation is small relative to the mean, suggesting high precision and consistency.
-
High RSD: Indicates that the standard deviation is large relative to the mean, suggesting low precision and significant variability.
A commonly used rule of thumb is that an RSD of less than 10% signifies good precision, while an RSD greater than 20% suggests poor precision. However, the acceptable RSD value ultimately depends on the context and the specific application.
Applications of Standard Deviation and Relative Standard Deviation
Both standard deviation and relative standard deviation find widespread applications across diverse fields:
1. Finance:
- Investment Risk Assessment: Standard deviation is a key metric in finance, used to measure the volatility or risk of an investment. A higher standard deviation signifies higher risk.
- Portfolio Optimization: Investors use standard deviation to diversify their portfolios and minimize overall risk.
- Performance Evaluation: Standard deviation helps assess the performance of investment funds and compare them against benchmarks.
2. Healthcare:
- Clinical Trials: Standard deviation is used to analyze the variability in treatment responses, helping determine the effectiveness of new drugs or therapies.
- Public Health: It plays a vital role in epidemiological studies, analyzing the spread of diseases and identifying risk factors.
- Diagnostic Testing: Standard deviation is crucial in assessing the reliability and precision of diagnostic tests.
3. Engineering and Manufacturing:
- Quality Control: Standard deviation helps monitor the consistency and quality of products by measuring the variation in manufacturing processes.
- Process Optimization: By analyzing standard deviation, engineers can identify areas where processes can be improved to reduce variability and improve efficiency.
- Tolerance Analysis: It's used to determine the acceptable range of variation in product dimensions and performance characteristics.
4. Social Sciences:
- Survey Research: Standard deviation measures the variability in responses to survey questions, providing insights into population characteristics and attitudes.
- Social Trends Analysis: It helps researchers analyze changes in social trends over time, identifying patterns and variations.
- Statistical Modeling: Standard deviation is a fundamental component of many statistical models used in social science research.
5. Environmental Science:
- Pollution Monitoring: Standard deviation helps analyze the variability in pollutant levels, identifying areas with high pollution concentrations.
- Climate Change Research: It is used to analyze the variability in climate data, helping scientists understand climate patterns and predict future changes.
- Ecological Studies: Standard deviation assists in assessing the variability in population sizes and ecological communities.
Choosing Between Standard Deviation and Relative Standard Deviation
The choice between standard deviation and relative standard deviation depends on the context and the specific research question:
-
Use Standard Deviation when: You need an absolute measure of variability, irrespective of the mean's magnitude. This is often the case when comparing datasets with similar scales.
-
Use Relative Standard Deviation when: You need a standardized measure of variability to compare datasets with different means or units. RSD provides a relative measure of dispersion, allowing for easier comparison across different datasets.
Limitations of Standard Deviation and Relative Standard Deviation
While incredibly useful, both standard deviation and relative standard deviation have limitations:
-
Sensitivity to Outliers: Both metrics are sensitive to outliers (extreme values in the dataset). Outliers can significantly inflate the standard deviation and RSD, potentially misrepresenting the typical variability. Robust statistical methods may be necessary to address this issue.
-
Assumption of Normality: While not strictly required, both metrics are most effectively interpreted when the data is approximately normally distributed. Severe deviations from normality can affect the meaningfulness of the results.
-
Not Suitable for all Data Types: These metrics are primarily suited for continuous numerical data. Their application to categorical or ordinal data may require careful consideration and potentially different statistical methods.
Conclusion
Standard deviation and relative standard deviation are powerful tools for understanding and quantifying data variability. They provide valuable insights across many fields, enabling better decision-making, process optimization, and a deeper understanding of complex systems. By understanding their calculations, interpretations, and limitations, researchers and practitioners can effectively utilize these statistical concepts to analyze data and draw meaningful conclusions. Remember to always consider the context of your data and choose the appropriate metric for your specific needs. Proper application of these methods requires careful consideration of data characteristics and potential limitations, ensuring reliable and insightful analyses.
Latest Posts
Latest Posts
-
What Is An Operator In Biology
Mar 17, 2025
-
How Many Symmetry Lines Does A Square Have
Mar 17, 2025
-
Do Viruses Belong To One Of The Domains Of Life
Mar 17, 2025
-
The C Shape Of The Tracheal Cartilages Is Important Because
Mar 17, 2025
-
Least Common Multiple Of 5 6 7
Mar 17, 2025
Related Post
Thank you for visiting our website which covers about Standard Deviation And Relative Standard Deviation . We hope the information provided has been useful to you. Feel free to contact us if you have any questions or need further assistance. See you next time and don't miss to bookmark.
