Which Is Not A Measure Of Dispersion
Juapaving
Mar 24, 2025 · 6 min read
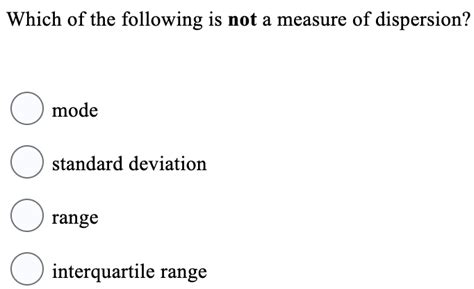
Table of Contents
Which is Not a Measure of Dispersion: A Comprehensive Guide
Understanding descriptive statistics is crucial for making sense of data. While measures of central tendency (like mean, median, and mode) tell us about the typical value in a dataset, measures of dispersion tell us how spread out the data is. Knowing which statistical measures don't reflect dispersion is equally important to avoid misinterpretations and ensure accurate data analysis. This comprehensive guide dives deep into the concept of dispersion, outlining what it is, identifying key measures, and importantly, highlighting what is not a measure of dispersion.
What is Dispersion in Statistics?
Dispersion, also known as variability or spread, quantifies the extent to which individual data points deviate from a central value. A high dispersion indicates that data points are widely scattered, while a low dispersion suggests that they are clustered closely around the central value. Understanding dispersion helps us grasp the data's heterogeneity and provides a more complete picture than measures of central tendency alone. For instance, two datasets might have the same mean but vastly different dispersions, indicating fundamentally different underlying distributions.
Key Measures of Dispersion
Before we identify what isn't a measure of dispersion, let's briefly review some common and crucial measures:
1. Range:
The range is the simplest measure of dispersion. It's calculated by subtracting the smallest value in the dataset from the largest value. While easy to compute, the range is highly sensitive to outliers. A single extreme value can drastically inflate the range, making it a less robust measure than others.
2. Interquartile Range (IQR):
The IQR is a more robust measure than the range as it's less susceptible to outliers. It represents the difference between the third quartile (75th percentile) and the first quartile (25th percentile) of the data. The IQR provides the spread of the middle 50% of the data, effectively ignoring extreme values.
3. Variance:
Variance measures the average squared deviation of each data point from the mean. It gives a quantitative measure of the spread, but its units are squared, making interpretation sometimes difficult.
4. Standard Deviation:
The standard deviation is the square root of the variance. It's expressed in the same units as the original data, making it easier to interpret than the variance. A larger standard deviation indicates greater dispersion.
5. Mean Absolute Deviation (MAD):
MAD calculates the average of the absolute deviations from the mean. It represents the average distance of each data point from the mean, providing a straightforward measure of spread. It's less sensitive to outliers than the standard deviation but less commonly used than the standard deviation.
What is NOT a Measure of Dispersion?
Several statistical measures, while providing valuable insights, do not quantify the spread or variability of the data. These are often confused with measures of dispersion but serve entirely different purposes. Let's examine some key examples:
1. Measures of Central Tendency (Mean, Median, Mode):
Mean, median, and mode describe the central tendency or typical value of a dataset. They indicate the location of the data's center, not how spread out the data is. While the mean can be used in the calculation of variance and standard deviation, it's not a measure of dispersion itself. For example, two datasets can have the same mean but vastly different spreads.
Example: Consider two datasets: A = {1, 2, 3, 4, 5} and B = {0, 1, 5, 9, 10}. Both have a mean of 3, but the dispersion in B is significantly larger than in A.
2. Skewness:
Skewness measures the asymmetry of a probability distribution. It indicates whether the data is skewed to the left (negatively skewed), symmetrical, or skewed to the right (positively skewed). Skewness doesn't directly quantify the spread; it describes the shape of the distribution. A highly skewed distribution can have a small or large spread, making skewness irrelevant to dispersion measurement.
3. Kurtosis:
Kurtosis measures the "tailedness" of the probability distribution. It indicates whether the data has heavy tails (leptokurtic), normal tails (mesokurtic), or thin tails (platykurtic). Similar to skewness, kurtosis is concerned with the shape of the distribution, not the spread. A distribution with high kurtosis can have a wide or narrow spread.
4. Probability Density Function (PDF):
The PDF represents the probability of a continuous random variable taking on a given value. While it gives a complete description of the distribution, it doesn't directly provide a single numerical value summarizing the dispersion. Analyzing the PDF might indirectly inform you about the spread, but it’s not a direct measure.
5. Cumulative Distribution Function (CDF):
The CDF indicates the probability that a random variable will be less than or equal to a certain value. While it’s valuable for understanding the distribution, the CDF itself isn't a measure of dispersion. Although information about spread is implicit in the CDF, you cannot calculate a single value representing dispersion from the CDF alone.
Common Mistakes and Misconceptions
It's essential to avoid common mistakes when interpreting statistical measures:
- Confusing central tendency with dispersion: Don't interpret the mean, median, or mode as indicating spread. They only describe the center.
- Over-reliance on the range: The range is highly susceptible to outliers and may not accurately represent the typical dispersion.
- Misinterpreting skewness and kurtosis as measures of spread: Skewness and kurtosis describe the shape of the distribution, not its spread.
- Assuming a high mean implies high dispersion: A high mean doesn't necessarily imply a high spread. Similarly, a low mean doesn't automatically mean low dispersion.
Practical Applications and Importance
Understanding the difference between measures of dispersion and other statistical measures is crucial in various fields:
- Finance: Assessing the risk of investments, measuring the volatility of stock prices, and analyzing portfolio performance require a robust understanding of dispersion measures like standard deviation.
- Engineering: Quality control and process optimization often use dispersion measures to evaluate the consistency and variability of production outputs.
- Healthcare: Analyzing patient data, such as blood pressure or cholesterol levels, requires understanding the spread to identify trends and potential health risks.
- Environmental Science: Studying environmental variables like temperature or pollution levels needs effective use of dispersion to analyze variability and understand patterns.
- Social Sciences: Analyzing survey data, measuring income inequality, and evaluating social disparities require understanding and appropriately employing measures of dispersion.
Conclusion:
Measures of dispersion are essential tools for understanding the variability in datasets. By differentiating them from measures of central tendency, skewness, kurtosis, and other descriptive statistics, we can accurately interpret data and make informed conclusions. A strong understanding of dispersion, and what it is not, is a cornerstone of effective data analysis across numerous disciplines. Avoiding the common misconceptions discussed will ensure you extract accurate insights and make data-driven decisions with confidence. Remember to choose the appropriate measure of dispersion based on the dataset's characteristics and the research question being addressed.
Latest Posts
Latest Posts
-
Relation Between Angular Acceleration And Linear Acceleration
Mar 25, 2025
-
John Drives To His Workplace And Back Home
Mar 25, 2025
-
What Is The Division Of Cytoplasm Called
Mar 25, 2025
-
3 1 8 As A Decimal
Mar 25, 2025
-
What Is A Factor Of 5
Mar 25, 2025
Related Post
Thank you for visiting our website which covers about Which Is Not A Measure Of Dispersion . We hope the information provided has been useful to you. Feel free to contact us if you have any questions or need further assistance. See you next time and don't miss to bookmark.
