What Is The Difference Between Percentage And Percentile
Juapaving
Mar 17, 2025 · 6 min read
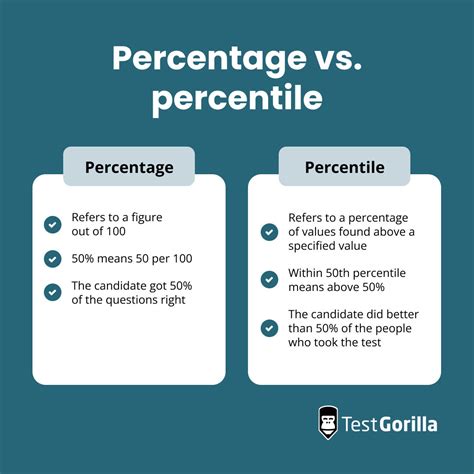
Table of Contents
What's the Difference Between Percentage and Percentile? A Deep Dive
Understanding the difference between percentages and percentiles is crucial for anyone working with data analysis, statistics, or even just interpreting data presented in the media. While both relate to portions of a whole, they do so in fundamentally different ways. This article will provide a comprehensive explanation, clarifying the concepts and highlighting their practical applications.
Percentages: Parts of a Whole
A percentage represents a fraction of 100. It expresses a proportion as a number out of 100. The symbol used to denote percentage is the percent sign (%). A percentage is a relative value that indicates the proportion of one quantity relative to another. For example, if you scored 85 out of 100 on a test, you achieved an 85% score. This means you answered 85 out of every 100 possible questions correctly.
Key characteristics of percentages:
- Relative to a total: Percentages are always relative to a specific total or whole. The total is crucial for interpreting the percentage meaning. A score of 85% on a 100-question test is different from an 85% score on a 50-question test.
- Scale of 0-100: Percentages range from 0% (representing nothing) to 100% (representing the entire whole). Values outside this range are not typically used in standard percentage calculations, although situations like percentage change can result in values exceeding 100% or falling below 0%.
- Easy to understand: Percentages offer an intuitive and easily understandable way to represent proportions, making them widely used in everyday life. They are utilized in various contexts, from discounts and interest rates to exam scores and population statistics.
- Calculation: Calculating a percentage involves finding a fraction of a total and multiplying it by 100. For instance, to find 20% of 50, you would calculate (20/100) * 50 = 10.
Examples of percentage usage:
- Sales discounts: A 20% discount on a $100 item means you pay $80.
- Interest rates: A 5% interest rate on a loan means you pay 5% of the principal amount annually.
- Test scores: A 90% score on an exam indicates you answered 90% of the questions correctly.
- Population statistics: The percentage of a population living in urban areas is a common demographic indicator.
Percentiles: Position within a Ranked Data Set
A percentile is a value that indicates the percentage of data points in a dataset that fall below that value. It represents a relative standing within a ranked distribution. Percentiles are used to describe the distribution of a dataset, particularly when the data is ordered. For instance, the 75th percentile is the value below which 75% of the data points lie.
Key characteristics of percentiles:
- Ranked data: Percentiles require a dataset that can be ranked or ordered from lowest to highest (or vice versa). The data does not need to be numerical; it could be ranked based on any orderable characteristic.
- Relative position: A percentile describes the position of a value within the ranked dataset, not its specific numerical value.
- Scale of 0-100: Similar to percentages, percentiles range from 0 to 100. The 0th percentile represents the minimum value, while the 100th percentile represents the maximum value in the dataset.
- Interpretation: The kth percentile indicates that k% of the observations are less than or equal to that value. This is a crucial distinction from percentages which focus on proportional representation rather than relative position within a dataset.
- Calculation: Percentile calculation involves ordering the data, finding the index based on the desired percentile, and then interpolating between data points if necessary (especially for larger datasets). Multiple methods exist for percentile calculation, potentially leading to minor differences in results across different software packages or statistical software. These differences are usually negligible, though, and the general principle remains the same.
Examples of percentile usage:
- Test scores: If your score is at the 90th percentile, it means you scored higher than 90% of the other test-takers.
- Income distribution: The 25th percentile of income shows the income level below which 25% of the population earns.
- Height and weight: Percentiles are commonly used to track the growth of children, comparing their height and weight to other children of the same age. For instance, a child in the 70th percentile for height is taller than 70% of children their age.
- Medical data: Percentiles are frequently utilized in medical studies to analyze various health indicators and diagnose conditions.
Key Differences Summarized
| Feature | Percentage | Percentile |
|---|---|---|
| Definition | Fraction of 100 | Value below which a certain percentage of data falls |
| Data Type | Any quantity | Ranked data (ordered dataset) |
| Interpretation | Proportion relative to a total | Relative position within a ranked dataset |
| Focus | Part of a whole | Position within a distribution |
| Calculation | Simple fraction calculation (x/100) * total | More complex, involves ranking and interpolation |
Practical Applications and Examples
Let's illustrate the differences with concrete examples:
Scenario 1: Exam Scores
Imagine a class of 100 students took an exam. Sarah scored 80 out of 100. This is an 80% score—she answered 80% of the questions correctly.
Now, let's say Sarah's score is at the 90th percentile. This means that Sarah scored higher than 90% of the other students in the class, regardless of her actual raw score. Her raw score might have been 80/100, but her relative performance compared to others is much higher. This is where the distinction is crucial. Her percentage score describes her raw performance on the exam itself, but her percentile rank describes her performance relative to her peers.
Scenario 2: Income Distribution
Let's consider the income distribution of a city. The average income might be $50,000. This is a simple average (sum of incomes divided by the number of people). But the 80th percentile income might be $85,000. This signifies that 80% of the population earns less than $85,000. The average income (using a percentage calculation) and the percentile (indicating relative position) present different yet complimentary insights into income distribution within the city. The percentile helps understand the shape of the distribution and identify potential income inequality.
Scenario 3: Height of Children
A pediatrician might tell you that your child is at the 75th percentile for height. This doesn't mean your child's height is 75% of something; it means your child is taller than 75% of children of the same age and sex. The raw height measurement itself is not the focus; the relative ranking of your child's height within the reference population is the critical piece of information.
Common Misconceptions
A common misunderstanding is equating percentages and percentiles. They are distinct concepts, despite both dealing with proportions or portions of a whole. Percentages focus on a proportion relative to a total; percentiles focus on a value's rank within an ordered dataset. It's vital to understand the context to avoid misinterpretations.
Conclusion
Percentages and percentiles are essential tools for data analysis and interpretation. Percentages express proportions relative to a total, while percentiles indicate the position of a value within a ranked dataset. Understanding the nuanced differences is crucial for accurate interpretation of data in various fields, from education and finance to healthcare and social sciences. By mastering the concepts of percentages and percentiles, you equip yourself with powerful tools for understanding and communicating data effectively.
Latest Posts
Latest Posts
-
Balanced Equation For Sodium Carbonate And Hydrochloric Acid
Mar 17, 2025
-
A Animal That Lays Eggs And Is Not A Bird
Mar 17, 2025
-
What Part Of The Cell Stores Water
Mar 17, 2025
-
How Many Sides Are In A Parallelogram
Mar 17, 2025
-
How To Change A Ratio Into A Percentage
Mar 17, 2025
Related Post
Thank you for visiting our website which covers about What Is The Difference Between Percentage And Percentile . We hope the information provided has been useful to you. Feel free to contact us if you have any questions or need further assistance. See you next time and don't miss to bookmark.
