What Is On A Physical Map
Juapaving
Apr 01, 2025 · 6 min read
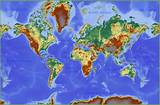
Table of Contents
What's on a Physical Map? A Comprehensive Guide
Physical maps, unlike their political counterparts focusing on boundaries and governance, provide a visual representation of Earth's natural features. They're windows into our planet's topography, revealing mountains that pierce the sky, valleys that carve deep into the land, and oceans that cover most of its surface. Understanding what constitutes a physical map is key to interpreting its information and utilizing it effectively, whether for academic study, travel planning, or recreational exploration. This guide delves into the essential elements found on a typical physical map, exploring their purpose and significance.
The Foundation: Relief and Elevation
The most fundamental aspect of a physical map is its depiction of relief, or the variations in the Earth's surface. This is primarily achieved through illustrating elevation, the height of a landform above sea level. Several techniques are employed to represent this crucial data:
1. Contour Lines: The Backbone of Elevation
Contour lines are arguably the most important feature for showcasing elevation. These imaginary lines connect points of equal elevation. Closely spaced contour lines indicate steep slopes, while widely spaced lines signify gentle slopes or flat terrain. The closer the lines are packed together, the steeper the incline. This allows for a precise understanding of the terrain's profile, making it invaluable for hikers, climbers, and anyone navigating challenging landscapes.
2. Hachures: Illustrating Steepness
Hachures are short, closely spaced lines drawn perpendicular to contour lines. They are primarily used to represent steep slopes or cliffs where contour lines would become too crowded or difficult to interpret. The density of hachures directly corresponds to the steepness of the slope, providing an immediate visual cue to challenging terrain.
3. Hypsometric Tinting: Color-Coded Elevation
Hypsometric tinting, or layer tinting, uses different colors to represent different elevation ranges. This allows for a quick visual assessment of the overall topography. Typically, lower elevations are represented by greens, gradually transitioning to yellows, oranges, browns, and even whites for the highest peaks. This color-coding provides a context for the contour lines, making the map easier to read and understand at a glance.
4. Spot Heights: Precise Elevation Markers
Spot heights, sometimes referred to as benchmarks, indicate the precise elevation of a specific point on the map. They are usually marked with a number representing the elevation in feet or meters. These points are crucial for precise measurements and are often used as reference points for surveying and other geographic applications.
Beyond Elevation: Representing Other Physical Features
While elevation is paramount, a complete physical map incorporates numerous other features to create a comprehensive representation of the landscape. These include:
1. Water Bodies: Oceans, Lakes, and Rivers
The depiction of water bodies is crucial for understanding the geography. Oceans, seas, lakes, rivers, and streams are typically represented by blue shading or coloring, with darker shades often indicating deeper water. Rivers are shown as flowing lines, often with arrowheads indicating the direction of flow. The size and shape of water bodies provide vital information about the hydrological features of a region.
2. Vegetation: Forests, Grasslands, and Deserts
The type and density of vegetation are often represented through different symbols, colors, or patterns. Dense forests might be depicted with green shading, while grasslands could be represented with lighter green or even yellow. Deserts might be shown with light brown or tan colors. This adds a crucial ecological dimension to the map, illustrating biodiversity and land use patterns.
3. Landforms: Mountains, Valleys, and Plains
Beyond elevation representation, physical maps often highlight specific landforms using various techniques. Mountain ranges are depicted as chains of peaks, often with contour lines illustrating their slopes. Valleys are shown as depressions in the land, often characterized by contour lines that form a “V” shape pointing uphill. Plains are usually represented by relatively flat areas with widely spaced contour lines.
4. Relief Shading: Adding Depth and Dimension
Relief shading, also known as hill shading, uses light and shadow to create a three-dimensional effect on the map. This technique simulates the way sunlight would illuminate the terrain, enhancing the perception of depth and making it easier to visualize the landscape's three-dimensional shape. Relief shading is often combined with other techniques like contour lines and hypsometric tinting to create a more realistic and visually appealing map.
Symbols and Legends: Deciphering the Map's Language
Physical maps utilize a variety of symbols and a legend (or key) to represent different features. The legend acts as a guide, explaining the meaning of each symbol used on the map. Understanding the legend is critical for accurate interpretation. Symbols can represent everything from:
- Types of vegetation: Deciduous forests, coniferous forests, grasslands, etc.
- Land use: Agricultural areas, urban areas, parks, etc.
- Points of interest: Mountain peaks, waterfalls, lakes, etc.
- Infrastructure: Roads, railroads, bridges, etc.
Different mapping organizations may use slightly different symbols, so always refer to the map's legend for accurate interpretation.
Scale: Understanding the Map's Proportions
The scale of a map is crucial for understanding its proportions. It represents the relationship between the distance on the map and the corresponding distance on the ground. Scales are typically represented as a ratio (e.g., 1:50,000) or as a bar scale (a visual representation of the distance). Understanding the scale allows for accurate distance calculations and spatial reasoning.
Map Projections: Flattening the Globe
Because the Earth is a sphere, representing it on a flat surface requires a map projection. This process introduces some distortion, particularly in terms of area, shape, or distance. Different projections are optimized for different purposes, and understanding the type of projection used on a specific map is important for interpreting the information accurately. Common projections include Mercator, Lambert Conformal Conic, and Albers Equal-Area Conic, each with its own strengths and limitations.
Integrating Information: A Holistic View
The power of a physical map lies in its ability to integrate various types of information. By combining elevation data with information about water bodies, vegetation, landforms, and other features, physical maps offer a holistic view of a region's geography. This integrated approach allows for a more complete understanding of the landscape's complexity and its influence on human activities and natural processes.
Beyond the Basics: Specialized Physical Maps
While the elements discussed above represent the core components of a physical map, specialized maps exist that focus on specific aspects of physical geography. These might include:
- Topographic maps: Highly detailed maps emphasizing elevation and contour lines, often used for surveying, engineering, and hiking.
- Geological maps: Maps illustrating the distribution of rocks, minerals, and geological formations.
- Soil maps: Maps depicting the different types and properties of soils in a region.
- Climate maps: Maps illustrating various climatic variables such as temperature, precipitation, and wind patterns.
These specialized maps build upon the foundational principles of physical mapping, offering more focused information for specific applications.
Conclusion: The Enduring Importance of Physical Maps
Despite the rise of digital mapping technology, physical maps continue to hold significant value. Their tangible nature, ability to provide a holistic overview, and lack of reliance on technology make them indispensable tools for education, exploration, and various professional applications. Understanding the elements of a physical map empowers users to extract meaningful information and gain a deeper appreciation for the Earth's diverse and dynamic landscape. From the intricacies of contour lines to the visual impact of relief shading, every component contributes to a comprehensive representation of our planet's physical features, offering insights that extend beyond mere geographical data and foster a deeper connection with the world around us.
Latest Posts
Latest Posts
-
What Is 3 Of 1 Million
Apr 02, 2025
-
In What Cell Organelle Does Photosynthesis Occur
Apr 02, 2025
-
Name 3 Kinds Of Hard Part Fossils
Apr 02, 2025
-
Convert 100 Degrees Celsius To Fahrenheit
Apr 02, 2025
-
How To Find Period Of A Trig Eqn
Apr 02, 2025
Related Post
Thank you for visiting our website which covers about What Is On A Physical Map . We hope the information provided has been useful to you. Feel free to contact us if you have any questions or need further assistance. See you next time and don't miss to bookmark.
