What Does The Slope Of A Distance Time Graph Indicate
Juapaving
Mar 27, 2025 · 5 min read
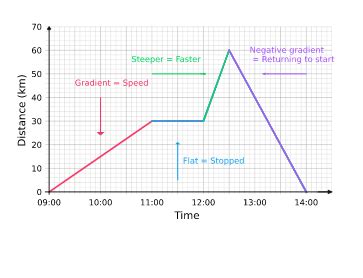
Table of Contents
What Does the Slope of a Distance-Time Graph Indicate?
Understanding the slope of a distance-time graph is fundamental to comprehending motion and its representation. This comprehensive guide delves deep into the meaning of this slope, exploring its various interpretations, applications, and implications in different scenarios. We'll move beyond the simple "speed" explanation to uncover a richer understanding of velocity, including its direction and the nuances of constant and non-constant motion.
The Fundamental Meaning: Speed and Velocity
The most basic interpretation of the slope of a distance-time graph is speed. For a straight-line graph, the slope represents the average speed over the entire time interval shown. We calculate this by finding the change in distance (Δd) divided by the change in time (Δt):
Slope = Δd/Δt = (Distance₂ - Distance₁)/(Time₂ - Time₁)
This gives us the rate at which the distance is changing with respect to time. However, it’s crucial to distinguish between speed and velocity.
- Speed is a scalar quantity, meaning it only has magnitude (size). It tells us how fast something is moving.
- Velocity is a vector quantity, possessing both magnitude and direction. It tells us how fast and in what direction something is moving.
A distance-time graph only directly reveals the magnitude; to understand the direction, we need additional context. For example, if the distance is increasing over time, the velocity is positive (assuming the positive direction is defined as the direction of increasing distance). If the distance is decreasing, the velocity is negative.
Interpreting Slopes: Different Scenarios
Let’s examine how the slope reveals different aspects of motion:
1. Constant Speed/Velocity: The Straight Line
A straight line on a distance-time graph signifies constant speed or velocity. The slope of this line is constant, reflecting a uniform rate of change in distance over time. The steeper the line, the faster the speed or velocity. A horizontal line (zero slope) indicates no movement (zero speed/velocity).
Example: A car traveling at a steady 60 km/h on a straight highway will produce a straight line on a distance-time graph. The slope of this line will be 60 km/h.
2. Non-Constant Speed/Velocity: The Curve
A curved line on a distance-time graph indicates non-constant speed or velocity. The slope is continuously changing, reflecting varying rates of change in distance over time. At any given point on the curve, the slope represents the instantaneous speed or velocity. This is determined by drawing a tangent line to the curve at that point and calculating the slope of the tangent.
Example: A car accelerating from rest will have a curved distance-time graph. The slope will be increasing, indicating increasing speed. Similarly, a car decelerating to a stop will show a curve with a decreasing slope.
3. Changes in Direction: The Implications of Negative Velocity
While a distance-time graph primarily shows distance, it indirectly suggests changes in direction if the graph shows distance decreasing over time. This signifies a negative velocity. However, understanding the direction requires additional information, such as the context of the motion (e.g., a car reversing). In contrast, a displacement-time graph will clearly show the direction of movement by showing negative displacement.
4. Calculating Acceleration from a Distance-Time Graph (Indirectly)
A distance-time graph does not directly show acceleration. However, we can infer changes in acceleration by analyzing the curvature of the graph. A rapidly increasing slope suggests increasing acceleration (positive acceleration), while a rapidly decreasing slope indicates deceleration (negative acceleration). To determine the precise numerical value of acceleration, further analysis using calculus (specifically, finding the second derivative of the distance function with respect to time) is required. This is beyond the scope of simple graphical interpretation.
Advanced Interpretations and Applications
The slope of a distance-time graph has broader implications beyond basic speed calculations:
1. Comparing Motion: Racing Scenarios
Distance-time graphs are extremely useful when comparing the motion of multiple objects. By plotting the distance-time data for each object on the same graph, we can instantly visualize which object is faster, slower, or if they are ever at the same position. The steeper the line for an object, the faster it’s traveling. Intersections of lines indicate times when the objects are at the same distance from the starting point.
2. Modeling Real-World Scenarios
Distance-time graphs are valuable tools for modeling various real-world phenomena, including:
- Traffic flow: Analyzing traffic patterns and identifying bottlenecks.
- Ballistics: Modeling the trajectory of a projectile.
- Epidemiology: Tracking the spread of a disease.
- Environmental studies: Monitoring animal migration patterns.
By plotting collected data, we can gain insights into the underlying dynamics of the system.
3. Predictive Modeling
Based on the established trends in a distance-time graph, it may be possible to extrapolate and predict future positions. This predictive capacity is especially valuable in scenarios where real-time data acquisition is limited or expensive. However, it is crucial to acknowledge that extrapolations are only reliable within the range of existing data and under the assumption that the underlying trends continue.
The Importance of Proper Scaling and Labeling
The accuracy of interpretations drawn from a distance-time graph hinges on proper scaling and labeling. The axes must be clearly labeled with appropriate units (e.g., meters for distance, seconds for time) and scales chosen to effectively display the data without distortion. Inconsistent scaling can lead to misinterpretations of the slope and the overall motion depicted.
Differentiating Distance-Time Graphs from Speed-Time Graphs
It's crucial to distinguish between distance-time graphs and speed-time graphs. While a distance-time graph's slope represents speed/velocity, a speed-time graph's slope represents acceleration. The area under a speed-time graph represents the distance traveled. Understanding this difference is vital for proper interpretation and analysis of motion.
Conclusion: A Versatile Tool for Understanding Motion
The slope of a distance-time graph offers a powerful and versatile tool for analyzing and interpreting motion. It provides not only a measure of speed or velocity but also insights into the nature of the motion itself, whether constant or changing, and its implications in various contexts. By understanding how to interpret the slope, we can gain a deeper understanding of motion and its applications in numerous fields. Mastering this concept is a cornerstone of understanding kinematics and the fundamental principles of physics. Remember to always carefully consider the context of the motion and the limitations of the graphical representation for a complete and accurate interpretation.
Latest Posts
Latest Posts
-
How To Find The Latus Rectum Of A Parabola
Mar 30, 2025
-
Greatest Common Factor Of 24 And 30
Mar 30, 2025
-
What Are All Of The Factors Of 49
Mar 30, 2025
-
Lowest Common Factor Of 3 And 8
Mar 30, 2025
-
Five Letter Words Starting With Ra
Mar 30, 2025
Related Post
Thank you for visiting our website which covers about What Does The Slope Of A Distance Time Graph Indicate . We hope the information provided has been useful to you. Feel free to contact us if you have any questions or need further assistance. See you next time and don't miss to bookmark.
