The Slope Of A Line On A Distance-time Graph Is
Juapaving
Mar 29, 2025 · 5 min read
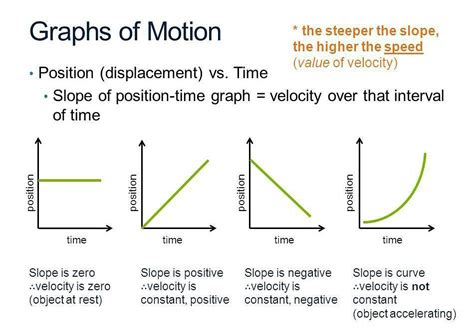
Table of Contents
The Slope of a Line on a Distance-Time Graph Is... Speed!
Understanding graphs is crucial in numerous fields, from physics and engineering to economics and finance. One of the most fundamental graphs is the distance-time graph, which plots distance traveled against the time taken. The seemingly simple slope of a line on this graph holds immense significance: it represents the speed of the object. This article will delve deep into understanding this relationship, exploring various scenarios, interpreting different slopes, and highlighting the importance of this concept.
Decoding the Distance-Time Graph
A distance-time graph illustrates the relationship between the distance an object travels and the time it takes to cover that distance. The horizontal axis (x-axis) represents time, usually measured in seconds, minutes, hours, or even days, depending on the context. The vertical axis (y-axis) represents the distance traveled, typically measured in meters, kilometers, miles, or any other suitable unit. Each point on the graph represents a specific distance covered at a particular time.
Types of Lines and Their Meanings
The line on a distance-time graph provides vital information about the object's motion. Several scenarios can be represented:
-
A straight line with a positive slope: This indicates constant speed. The steeper the line, the faster the speed. A gentle slope suggests a slower speed.
-
A horizontal line (slope = 0): This signifies that the object is stationary; it's not moving, and its distance remains unchanged over time.
-
A curved line: This indicates a changing speed. The curve's steepness reflects the rate at which the speed is changing. A steeper curve means a faster change in speed (greater acceleration or deceleration).
-
A straight line with a negative slope: This is a less common scenario in simple distance-time graphs, but it can represent an object moving backwards towards its starting point.
Calculating Speed from the Slope
The slope of a line on a distance-time graph is mathematically defined as the change in distance divided by the change in time. This is precisely the definition of speed:
Speed = (Change in Distance) / (Change in Time)
Or, using more formal notation:
Speed = ΔDistance / ΔTime
Where:
- ΔDistance represents the change in distance (final distance - initial distance).
- ΔTime represents the change in time (final time - initial time).
This means that the slope's numerical value directly represents the object's speed. For example, if the slope is 5 meters per second (m/s), the object is traveling at a constant speed of 5 m/s.
Example Calculation
Let's consider a simple example. Suppose a car travels 100 kilometers in 2 hours. Plotting this on a distance-time graph gives us two points: (0 hours, 0 km) and (2 hours, 100 km).
To calculate the speed, we use the slope formula:
Speed = (100 km - 0 km) / (2 hours - 0 hours) = 50 km/hour
Therefore, the car's speed is 50 kilometers per hour.
Interpreting Different Slopes and Their Implications
The slope's magnitude and direction hold crucial information about the object's motion:
1. Positive Slope: Constant Speed
A straight line with a positive slope indicates uniform motion; the object is traveling at a constant speed. The steeper the slope, the greater the speed. This is because a steeper slope implies a larger change in distance for a given change in time.
2. Zero Slope: Stationary Object
A horizontal line (zero slope) implies that the distance remains constant over time. This indicates that the object is not moving; it's stationary. The speed is zero.
3. Curved Line: Changing Speed (Acceleration or Deceleration)
A curved line on a distance-time graph depicts non-uniform motion. The object's speed is changing over time. A concave upward curve represents acceleration (increasing speed), while a concave downward curve indicates deceleration (decreasing speed). The curvature's steepness reflects the rate of change in speed.
4. Negative Slope: Reverse Motion
While less common in basic distance-time graphs, a line with a negative slope represents the object moving backward towards its starting point. The magnitude of the negative slope indicates the speed of this reverse motion.
Beyond Simple Distance-Time Graphs: Advanced Applications
The concept of slope on a distance-time graph extends beyond simple scenarios. It is crucial for understanding and analyzing more complex motion:
1. Instantaneous Speed
While the slope provides the average speed over an interval, calculus allows us to calculate the instantaneous speed at any specific point on a curved line. The instantaneous speed is the slope of the tangent line to the curve at that point.
2. Multi-Stage Journeys
Many real-world journeys involve multiple stages with varying speeds. A distance-time graph can represent such journeys as a series of line segments, each with its own slope representing the speed during that stage. Analyzing the slopes of these segments provides insight into the overall journey.
3. Real-World Applications
The ability to interpret distance-time graphs and understand their slopes is essential in many areas:
- Physics: Analyzing the motion of objects, calculating velocity and acceleration.
- Engineering: Designing transportation systems, optimizing travel routes.
- Sports Science: Monitoring athlete performance, analyzing speed and endurance.
- Traffic Engineering: Modeling traffic flow, identifying congestion points.
Conclusion: The Power of Visual Representation
The distance-time graph is a powerful tool for visualizing and analyzing motion. The slope of a line on this graph provides invaluable information about an object's speed, whether constant or changing. Understanding this simple yet fundamental concept is essential for anyone working with motion, data analysis, or any field involving the representation of change over time. Mastering the interpretation of slopes on distance-time graphs opens up a deeper understanding of the world around us, allowing us to analyze and predict motion with increased accuracy and precision. From simple calculations to complex scenarios involving acceleration and deceleration, the slope remains a key element in unlocking the secrets of motion hidden within a seemingly simple graph.
Latest Posts
Latest Posts
-
What Is The Lcm Of 4 And 5
Apr 01, 2025
-
What Is The Symbol For Magnesium
Apr 01, 2025
-
Moral Of The Lion And The Mouse Story
Apr 01, 2025
-
What Is The Lcm Of 11 And 4
Apr 01, 2025
-
What Is The Gcf Of 72 And 120
Apr 01, 2025
Related Post
Thank you for visiting our website which covers about The Slope Of A Line On A Distance-time Graph Is . We hope the information provided has been useful to you. Feel free to contact us if you have any questions or need further assistance. See you next time and don't miss to bookmark.
