Find The Value Of The Linear Correlation Coefficient R
Juapaving
Mar 17, 2025 · 7 min read
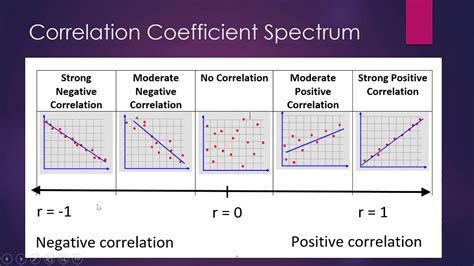
Table of Contents
Finding the Value of the Linear Correlation Coefficient (r): A Comprehensive Guide
The linear correlation coefficient, denoted by r, is a crucial statistical measure that quantifies the strength and direction of a linear relationship between two variables. Understanding how to calculate and interpret r is essential in various fields, from scientific research to business analytics. This comprehensive guide will walk you through the process of finding the value of r, explaining the underlying concepts and providing practical examples.
Understanding the Linear Correlation Coefficient (r)
The correlation coefficient r always falls within the range of -1 to +1. Its value provides insights into the relationship between two variables:
- r = +1: Indicates a perfect positive linear correlation. As one variable increases, the other increases proportionally.
- r = -1: Indicates a perfect negative linear correlation. As one variable increases, the other decreases proportionally.
- r = 0: Indicates no linear correlation between the variables. Note that this doesn't necessarily mean there's no relationship, just no linear relationship. There could be a non-linear relationship.
- 0 < r < +1: Indicates a positive linear correlation. The closer r is to +1, the stronger the correlation.
- -1 < r < 0: Indicates a negative linear correlation. The closer r is to -1, the stronger the correlation.
The absolute value of r represents the strength of the correlation, while the sign indicates the direction. For example, r = 0.8 indicates a strong positive correlation, while r = -0.8 indicates a strong negative correlation.
Calculating the Linear Correlation Coefficient (r)
There are several ways to calculate r. The most common method uses the following formula:
r = Σ[(xi - x̄)(yi - ȳ)] / √[Σ(xi - x̄)²Σ(yi - ȳ)²]
Where:
- xi: Represents the individual values of the first variable.
- yi: Represents the individual values of the second variable.
- x̄: Represents the mean (average) of the first variable.
- ȳ: Represents the mean (average) of the second variable.
- Σ: Represents the summation (adding up all the values).
Let's break down the calculation step-by-step:
-
Calculate the means (x̄ and ȳ): Sum all the values for each variable and divide by the number of data points.
-
Calculate the deviations from the means (xi - x̄ and yi - ȳ): Subtract the mean of each variable from each individual value.
-
Calculate the product of deviations [(xi - x̄)(yi - ȳ)]: Multiply the deviation of each data point from the mean of the first variable by the deviation of the corresponding data point from the mean of the second variable.
-
Sum the products of deviations [Σ(xi - x̄)(yi - ȳ)]: Add up all the products of deviations calculated in step 3. This is the numerator of the formula.
-
Calculate the sum of squared deviations [Σ(xi - x̄)² and Σ(yi - ȳ)²]: Square each deviation from the mean for each variable and then sum these squared deviations.
-
Calculate the square root of the product of the sum of squared deviations [√[Σ(xi - x̄)²Σ(yi - ȳ)²]]: Multiply the sum of squared deviations for each variable and then take the square root of the product. This is the denominator of the formula.
-
Calculate the correlation coefficient (r): Divide the numerator (from step 4) by the denominator (from step 6). This gives you the value of the linear correlation coefficient.
Example Calculation
Let's illustrate this with an example. Suppose we have the following data for two variables, X and Y:
| X | Y |
|---|---|
| 1 | 2 |
| 2 | 3 |
| 3 | 5 |
| 4 | 4 |
| 5 | 6 |
Step 1: Calculate the means:
- x̄ = (1 + 2 + 3 + 4 + 5) / 5 = 3
- ȳ = (2 + 3 + 5 + 4 + 6) / 5 = 4
Step 2: Calculate the deviations from the means:
| X | Y | xi - x̄ | yi - ȳ |
|---|---|---|---|
| 1 | 2 | -2 | -2 |
| 2 | 3 | -1 | -1 |
| 3 | 5 | 0 | 1 |
| 4 | 4 | 1 | 0 |
| 5 | 6 | 2 | 2 |
Step 3: Calculate the product of deviations:
| X | Y | (xi - x̄) | (yi - ȳ) | (xi - x̄)(yi - ȳ) |
|---|---|---|---|---|
| 1 | 2 | -2 | -2 | 4 |
| 2 | 3 | -1 | -1 | 1 |
| 3 | 5 | 0 | 1 | 0 |
| 4 | 4 | 1 | 0 | 0 |
| 5 | 6 | 2 | 2 | 4 |
Step 4: Sum the products of deviations:
Σ[(xi - x̄)(yi - ȳ)] = 4 + 1 + 0 + 0 + 4 = 9
Step 5: Calculate the sum of squared deviations:
- Σ(xi - x̄)² = (-2)² + (-1)² + 0² + 1² + 2² = 10
- Σ(yi - ȳ)² = (-2)² + (-1)² + 1² + 0² + 2² = 10
Step 6: Calculate the square root of the product of the sum of squared deviations:
√[Σ(xi - x̄)²Σ(yi - ȳ)²] = √(10 * 10) = 10
Step 7: Calculate the correlation coefficient (r):
r = Σ[(xi - x̄)(yi - ȳ)] / √[Σ(xi - x̄)²Σ(yi - ȳ)²] = 9 / 10 = 0.9
Therefore, the linear correlation coefficient (r) for this data set is 0.9. This indicates a strong positive linear correlation between variables X and Y.
Interpreting the Correlation Coefficient
After calculating r, it's crucial to interpret the result in the context of the data. A high positive or negative r value suggests a strong linear relationship, while a value close to zero suggests a weak or no linear relationship. However, correlation does not imply causation. Just because two variables are correlated doesn't mean that one causes the other. There could be a third, unmeasured variable influencing both.
For example, a strong positive correlation between ice cream sales and drowning incidents doesn't mean that ice cream causes drowning. Both are likely influenced by a third variable: hot weather.
Using Technology to Calculate r
Calculating r by hand can be tedious, especially with large datasets. Statistical software packages like SPSS, R, Python (with libraries like NumPy and SciPy), and Excel can easily compute the correlation coefficient. These tools not only calculate r but also provide p-values, which help assess the statistical significance of the correlation. The p-value indicates the probability of observing the calculated correlation if there were actually no relationship between the variables. A low p-value (typically below 0.05) suggests that the correlation is statistically significant.
Beyond Linear Correlation: Exploring Other Relationships
While the linear correlation coefficient is valuable for assessing linear relationships, it's important to remember that not all relationships are linear. For instance, there might be a curvilinear relationship where the relationship between variables follows a curve rather than a straight line. In such cases, other statistical methods like non-linear regression analysis are more appropriate. Visualizing the data using scatter plots is a crucial first step to determine whether a linear correlation coefficient is the appropriate measure.
Important Considerations:
-
Outliers: Outliers (extreme values) can significantly influence the value of r. It's essential to examine the data for outliers and consider their impact on the analysis. Depending on the context, you might choose to remove or adjust outliers.
-
Sample Size: The reliability of the correlation coefficient increases with the sample size. A larger sample size generally leads to a more accurate and reliable estimate of the population correlation.
-
Causation vs. Correlation: Remember that correlation does not equal causation. A strong correlation simply indicates a relationship, not necessarily a causal link.
Conclusion
The linear correlation coefficient r is a powerful tool for quantifying the strength and direction of linear relationships between two variables. Understanding how to calculate and interpret r is crucial for drawing meaningful conclusions from data. While manual calculation is useful for understanding the underlying process, utilizing statistical software is highly recommended, especially for larger datasets. Always remember to consider potential outliers, sample size, and the crucial distinction between correlation and causation. By carefully analyzing the data and applying the appropriate statistical methods, you can gain valuable insights into the relationships between variables and make informed decisions based on your findings. Combining a strong understanding of the theoretical principles with the practical application of statistical software will equip you to effectively analyze data and communicate your findings effectively.
Latest Posts
Latest Posts
-
What Is The Percentage Of 3 16
Mar 18, 2025
-
How Many Kings Are In A 52 Card Deck
Mar 18, 2025
-
What Is 3 8 In Percentage
Mar 18, 2025
-
What Is 25 In A Decimal
Mar 18, 2025
-
The Scattering Of Light By Colloids Is Called
Mar 18, 2025
Related Post
Thank you for visiting our website which covers about Find The Value Of The Linear Correlation Coefficient R . We hope the information provided has been useful to you. Feel free to contact us if you have any questions or need further assistance. See you next time and don't miss to bookmark.
