Difference Between Normal And Binomial Distribution
Juapaving
Mar 13, 2025 · 6 min read
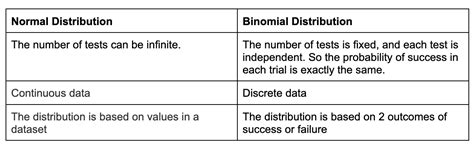
Table of Contents
Delving Deep into the Differences: Normal vs. Binomial Distribution
Understanding probability distributions is crucial in statistics, providing the framework for analyzing data and making informed predictions. Two of the most commonly encountered distributions are the normal and binomial distributions. While seemingly disparate, they share some similarities and possess distinct characteristics that define their applications. This comprehensive guide will dissect the differences between normal and binomial distributions, equipping you with the knowledge to choose the appropriate distribution for your data analysis needs.
Defining the Distributions: A Foundation for Understanding
Before diving into the differences, let's establish a clear understanding of each distribution.
The Normal Distribution: A Bell Curve Tale
The normal distribution, often called the Gaussian distribution, is a continuous probability distribution. This means it can take on any value within a given range. Its defining characteristic is its symmetrical bell-shaped curve. The curve is perfectly symmetrical around its mean (average), which is also its median (middle value) and mode (most frequent value).
Key features of the normal distribution:
- Symmetrical: The probability density is equal on both sides of the mean.
- Unimodal: It has only one peak (mode) at the mean.
- Defined by Mean (μ) and Standard Deviation (σ): These two parameters completely determine the shape and location of the normal curve. A higher standard deviation indicates a wider, flatter curve; a lower standard deviation indicates a narrower, taller curve.
- Empirical Rule (68-95-99.7 Rule): Approximately 68% of the data falls within one standard deviation of the mean, 95% within two standard deviations, and 99.7% within three standard deviations.
The normal distribution is ubiquitous in many natural phenomena, from heights and weights of individuals to test scores and measurement errors. Its prevalence stems from the Central Limit Theorem, which states that the average of a large number of independent and identically distributed random variables (regardless of their original distribution) will approximately follow a normal distribution.
The Binomial Distribution: Counting Successes
In contrast to the normal distribution, the binomial distribution is a discrete probability distribution. It deals with the probability of getting a certain number of "successes" in a fixed number of independent Bernoulli trials. A Bernoulli trial is an experiment with only two possible outcomes: success or failure.
Key features of the binomial distribution:
- Discrete: It only takes on integer values (0, 1, 2, 3….). You can't have 2.5 successes.
- Fixed Number of Trials (n): The experiment consists of a predetermined number of trials.
- Constant Probability of Success (p): The probability of success remains the same for each trial.
- Independent Trials: The outcome of one trial does not affect the outcome of any other trial.
- Defined by n and p: These two parameters completely specify the binomial distribution.
Examples of binomial distributions include the number of heads obtained when flipping a coin ten times, the number of defective items in a batch of 100, or the number of students who pass an exam.
Contrasting the Distributions: Key Differences
Now that we've established the basics, let's highlight the crucial distinctions between normal and binomial distributions:
| Feature | Normal Distribution | Binomial Distribution |
|---|---|---|
| Type | Continuous | Discrete |
| Data Type | Continuous variables (e.g., height, weight) | Count data (e.g., number of successes) |
| Parameters | Mean (μ) and Standard Deviation (σ) | Number of trials (n) and probability of success (p) |
| Shape | Symmetrical bell curve | Can be skewed, depending on p; symmetrical when p=0.5 |
| Range | (-∞, +∞) | 0 to n |
| Applications | Many natural phenomena, approximations | Counting successes in a series of trials |
Visualizing the Differences
The difference in their nature – continuous versus discrete – is best visualized graphically. A normal distribution is represented by a smooth curve, while a binomial distribution is represented by a bar graph or histogram. While a binomial distribution can approximate a normal distribution under certain conditions (explained below), the fundamental difference in their underlying nature remains.
When Binomial Approximates Normal: The Rule of Thumb
Although distinct, there's a crucial connection: under certain circumstances, a binomial distribution can be approximated by a normal distribution. This is particularly useful because calculations with the normal distribution are often simpler. The approximation is valid when:
- n is large: A common rule of thumb is that n should be greater than or equal to 30.
- p is not too close to 0 or 1: A common guideline is that both np and n(1-p) should be greater than or equal to 5.
This approximation leverages the Central Limit Theorem. Essentially, when the number of trials is large, the distribution of the number of successes begins to resemble a normal distribution. It's important to note this is an approximation and doesn't hold perfectly, particularly for small n or p values close to 0 or 1.
Choosing the Right Distribution: Practical Considerations
The choice between using a normal or binomial distribution depends heavily on the nature of your data and the research question.
-
Use the Normal Distribution when: You are dealing with continuous data that is approximately normally distributed or can be reasonably approximated by a normal distribution (e.g., through transformations). You are interested in probabilities associated with specific ranges of values.
-
Use the Binomial Distribution when: You are counting the number of successes in a fixed number of independent Bernoulli trials. You have a constant probability of success for each trial. You are interested in probabilities associated with a specific number of successes.
Advanced Concepts and Applications
Both normal and binomial distributions form the foundation for many statistical methods and concepts.
Confidence Intervals and Hypothesis Testing:
Both distributions are heavily used in constructing confidence intervals and conducting hypothesis tests. For example, in hypothesis testing about proportions (e.g., testing if a coin is fair), the binomial distribution is crucial, while testing the mean of a normally distributed population often utilizes the normal distribution (or the t-distribution for smaller sample sizes).
Regression Analysis:
While not directly related to the distributions themselves, the assumption of normality of residuals (the differences between observed and predicted values) is often made in regression analysis. This assumption allows for valid inferences and hypothesis tests related to the model.
Simulation and Modeling:
Both distributions are extensively used in simulation and modeling in various fields like finance, engineering, and healthcare. Monte Carlo simulations, for instance, frequently employ normal and binomial distributions to model random events and assess risk.
Conclusion: Understanding the Nuances
The normal and binomial distributions, while both probability distributions, have distinct characteristics that determine their applications. Understanding their differences—continuous vs. discrete, their defining parameters, and when a binomial distribution can be approximated by a normal distribution—is fundamental for accurate statistical analysis. This knowledge empowers you to select the appropriate model for your data, leading to robust and reliable conclusions. Remember that careful consideration of data characteristics and the research question is vital in choosing the right distribution for your analysis. Properly applying these distributions is key to navigating the world of data effectively and deriving meaningful insights.
Latest Posts
Latest Posts
-
Which 2 Planets Have No Moons
Mar 13, 2025
-
Determine The Order Of The Following Matrix
Mar 13, 2025
-
Is 89 A Prime Or Composite Number
Mar 13, 2025
-
What Is The Percent Of 3 2
Mar 13, 2025
-
What Is The Lcm Of 9 And 18
Mar 13, 2025
Related Post
Thank you for visiting our website which covers about Difference Between Normal And Binomial Distribution . We hope the information provided has been useful to you. Feel free to contact us if you have any questions or need further assistance. See you next time and don't miss to bookmark.
