Data And Types Of Data In Statistics
Juapaving
Mar 25, 2025 · 6 min read
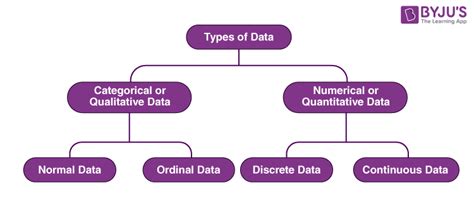
Table of Contents
Data and Types of Data in Statistics: A Comprehensive Guide
Statistics is the science of collecting, organizing, analyzing, interpreting, and presenting data. Data, at its core, is the raw material of statistics. Without data, there are no statistics. Understanding data and its various types is therefore paramount to anyone engaging in statistical analysis. This comprehensive guide will delve into the world of data, exploring its different forms and properties, and emphasizing its crucial role in statistical inference and decision-making.
What is Data?
In the simplest terms, data refers to raw, unorganized facts and figures. These facts and figures can represent anything from the number of cars passing a certain point on a highway to the responses on a customer satisfaction survey. It's important to note that data, in its raw form, is often meaningless. It only gains significance and provides insights when it's processed, analyzed, and interpreted using statistical methods. Think of data as the building blocks of knowledge; without proper construction (statistical analysis), you can't build a strong understanding of a phenomenon.
Types of Data: A Hierarchical Classification
Data can be classified in several ways, depending on the level of detail and the characteristics you wish to emphasize. A common and comprehensive way to categorize data is through a hierarchical classification system:
1. Qualitative vs. Quantitative Data
This is the most fundamental distinction in data types.
-
Qualitative Data (Categorical Data): This type of data describes qualities or characteristics. It's typically represented by labels or names and doesn't involve numerical values. Qualitative data can be further divided into:
- Nominal Data: Represents categories with no inherent order or ranking. Examples include colors (red, blue, green), gender (male, female), and types of fruit (apple, banana, orange). There's no inherent "better" or "worse" category.
- Ordinal Data: Represents categories with a meaningful order or ranking. Examples include customer satisfaction levels (very satisfied, satisfied, neutral, dissatisfied, very dissatisfied), educational levels (high school, bachelor's, master's, PhD), and rankings in a competition (first, second, third). While there's order, the differences between categories aren't necessarily equal.
-
Quantitative Data (Numerical Data): This type of data represents numerical values and can be measured. Quantitative data can be further categorized into:
- Discrete Data: This data can only take on specific, separate values, often whole numbers. It's usually the result of counting. Examples include the number of students in a class, the number of cars in a parking lot, and the number of defects in a batch of products.
- Continuous Data: This data can take on any value within a given range. It's typically the result of measuring. Examples include height, weight, temperature, and time. You could have a height of 175.5 cm or 175.52 cm, there's an infinite number of possible values within the range.
2. Levels of Measurement
Another important way to classify data is by its level of measurement, which reflects the information contained within the data:
-
Nominal Level: This is the lowest level of measurement. Data at this level is categorical, and the categories are mutually exclusive and exhaustive (every observation falls into only one category). There's no inherent order or ranking. Nominal data is typically analyzed using frequency counts and percentages. Examples include eye color and types of transportation.
-
Ordinal Level: Data at this level is also categorical, but the categories have a meaningful order or ranking. The distances between the categories are not necessarily equal. Examples include satisfaction ratings and educational levels. Statistical analysis on ordinal data often involves ranking and median calculations.
-
Interval Level: This level represents numerical data where the differences between values are meaningful and consistent. However, there is no true zero point. This means the ratio of values doesn't have a meaningful interpretation. A classic example is temperature measured in Celsius or Fahrenheit. The difference between 20°C and 30°C is the same as the difference between 30°C and 40°C, but 40°C is not twice as hot as 20°C.
-
Ratio Level: This is the highest level of measurement. Data at this level is numerical with a true zero point. The ratios of values are meaningful. Examples include height, weight, income, and age. All arithmetic operations (addition, subtraction, multiplication, division) are meaningful.
The Importance of Data Types in Statistical Analysis
Understanding the type of data you are working with is absolutely crucial for choosing the appropriate statistical methods. Applying inappropriate methods can lead to incorrect or misleading conclusions. For example:
-
Mean vs. Median: While the mean is a suitable measure of central tendency for continuous data with a normal distribution, it's highly susceptible to outliers. For skewed data or ordinal data, the median is a more robust measure.
-
Hypothesis testing: Different statistical tests are designed for different data types. A t-test might be appropriate for comparing means of two groups of continuous data, while a chi-square test would be used for analyzing the association between two categorical variables.
-
Data visualization: The choice of graph or chart also depends on the type of data. Bar charts are often used for categorical data, while histograms and scatter plots are common for numerical data.
Data Collection Methods
The quality of your statistical analysis is directly related to the quality of your data. Therefore, it's crucial to employ rigorous and appropriate data collection methods. Some common methods include:
-
Surveys: Used to collect data from a sample of individuals through questionnaires. Carefully designed questions are vital for obtaining reliable data.
-
Experiments: Involve manipulating variables to observe their effects. Random assignment of participants to different treatment groups helps to control for confounding variables.
-
Observations: Involve systematically observing and recording events or behaviors without intervention. This can be qualitative or quantitative, depending on the nature of the observations.
-
Administrative Data: Data collected by administrative bodies, such as government agencies or hospitals. This type of data is often readily available but may require careful cleaning and processing.
Data Cleaning and Preparation
Raw data often contains errors, inconsistencies, and missing values. Before performing any statistical analysis, it’s necessary to clean and prepare the data. This process involves:
-
Handling Missing Values: Missing values can be handled by deleting observations with missing data, imputing missing values (replacing them with estimated values), or using statistical methods that accommodate missing data.
-
Identifying and Correcting Errors: Errors can arise from data entry mistakes, instrument malfunctions, or other sources. Careful data validation and error correction are necessary.
-
Transforming Variables: Variables may need to be transformed to improve the fit of statistical models or to meet the assumptions of statistical tests. For instance, data transformation techniques, such as logarithmic transformation, can help to address skewness in data.
Conclusion
Data is the lifeblood of statistics. A thorough understanding of the different types of data, their properties, and the appropriate methods for their analysis is fundamental to conducting meaningful statistical research. By carefully considering the type of data being collected and analyzed, researchers can ensure the validity and reliability of their results, leading to informed decision-making in various fields. From basic descriptive statistics to complex inferential methods, the choice of techniques is intrinsically linked to the nature of the data. Therefore, mastering the classification and handling of data is not merely a technical skill but a cornerstone of statistical literacy. Remember, the quality of your data directly impacts the reliability and trustworthiness of your findings.
Latest Posts
Latest Posts
-
What Is The Lcm Of 4 8 10
Mar 28, 2025
-
What Triangle Has 2 Equal Sides
Mar 28, 2025
-
Metal Which Is Poor Conductor Of Heat
Mar 28, 2025
-
Nouns That Start With A V
Mar 28, 2025
-
A Piece Of Land Completely Surrounded By Water
Mar 28, 2025
Related Post
Thank you for visiting our website which covers about Data And Types Of Data In Statistics . We hope the information provided has been useful to you. Feel free to contact us if you have any questions or need further assistance. See you next time and don't miss to bookmark.
