What Does The Slope Of The Velocity Time Graph Represent
Juapaving
Mar 14, 2025 · 5 min read
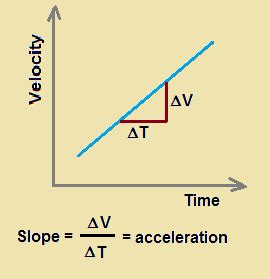
Table of Contents
What Does the Slope of a Velocity-Time Graph Represent? A Comprehensive Guide
Understanding the relationship between velocity, time, and acceleration is fundamental to grasping the core concepts of classical mechanics. One of the most powerful tools for visualizing this relationship is the velocity-time graph. But what exactly does the slope of this graph represent? This article delves deep into this question, exploring the concept with clear explanations, illustrative examples, and practical applications.
Deciphering the Velocity-Time Graph
A velocity-time graph plots velocity (usually on the y-axis) against time (on the x-axis). Each point on the graph represents the object's velocity at a specific moment in time. The shape of the graph reveals crucial information about the object's motion. A straight line indicates constant acceleration (or deceleration), while a curved line suggests changing acceleration.
The Significance of Slope
The slope of a velocity-time graph represents the acceleration of the object. This is a key concept that underpins much of our understanding of motion. Let's break this down:
-
Slope: Recall that the slope of a line is calculated as the change in the y-value divided by the change in the x-value. In the context of a velocity-time graph, this translates to:
Slope = (Change in Velocity) / (Change in Time)
-
Acceleration: Acceleration is defined as the rate of change of velocity. This is precisely what the slope of the velocity-time graph calculates: the change in velocity over a given time interval.
-
Units: The units of acceleration are derived from the units of velocity and time. If velocity is measured in meters per second (m/s) and time in seconds (s), then acceleration will be in meters per second squared (m/s²).
Interpreting Different Slopes
The slope's value and sign provide significant information about the object's motion:
1. Positive Slope: Positive Acceleration
A positive slope indicates that the velocity is increasing over time. This signifies positive acceleration, meaning the object is speeding up. The steeper the slope, the greater the acceleration. This could represent an object falling freely under gravity, a car accelerating from rest, or a rocket launching into space.
Example: Imagine a car accelerating uniformly from rest. Its velocity-time graph would be a straight line with a positive slope, showing a constant increase in velocity over time.
2. Zero Slope: Zero Acceleration (Constant Velocity)
A zero slope (a horizontal line) indicates that the velocity is not changing over time. This represents zero acceleration, also known as constant velocity. The object is moving at a constant speed in a constant direction.
Example: A car traveling at a steady 60 mph on a straight highway would have a velocity-time graph showing a horizontal line at the 60 mph mark.
3. Negative Slope: Negative Acceleration (Deceleration)
A negative slope indicates that the velocity is decreasing over time. This signifies negative acceleration, often called deceleration or retardation. The object is slowing down. Again, the steeper the slope (in the negative direction), the greater the deceleration.
Example: A car braking to a stop would have a velocity-time graph with a negative slope, showing a constant decrease in velocity until it reaches zero.
Beyond Straight Lines: Non-Uniform Acceleration
While the previous examples focused on constant acceleration (straight lines), real-world scenarios often involve changing acceleration (curved lines). In these cases, the slope at any given point on the curve represents the instantaneous acceleration at that specific moment.
To determine the instantaneous acceleration, one would need to calculate the slope of the tangent line to the curve at the point of interest. This involves using calculus, specifically the concept of derivatives. However, a basic understanding of the relationship between the slope and acceleration remains crucial.
Practical Applications and Examples
The concept of the slope of a velocity-time graph has far-reaching applications in various fields:
1. Physics:
- Projectile motion: Analyzing the trajectory of a projectile, determining its maximum height, and calculating its time of flight.
- Circular motion: Understanding the relationship between tangential velocity and angular acceleration.
- Simple harmonic motion: Describing the oscillatory motion of a pendulum or a mass on a spring.
2. Engineering:
- Vehicle dynamics: Designing safer and more efficient vehicles by analyzing their acceleration and deceleration profiles.
- Robotics: Controlling the movement of robots with precise acceleration and deceleration patterns.
- Aerospace engineering: Designing rockets and spacecraft with optimal trajectory and velocity profiles.
3. Sports Science:
- Biomechanics: Analyzing athletes' movements to improve performance and reduce injury risk.
- Training programs: Developing effective training programs based on athletes' acceleration capabilities.
Advanced Concepts and Considerations
While this article provides a foundational understanding, there are more advanced concepts to explore:
- Area under the curve: The area under a velocity-time graph represents the displacement of the object. This is a crucial concept for calculating the total distance traveled.
- Integration and Differentiation: As mentioned earlier, calculus is necessary for analyzing non-uniform acceleration and determining instantaneous acceleration and displacement precisely.
- Vectors: Velocity and acceleration are vector quantities, meaning they have both magnitude and direction. A more comprehensive analysis would incorporate vector notation and consider the direction of motion.
Conclusion
The slope of a velocity-time graph provides a powerful visual representation of an object's acceleration. Understanding this relationship is fundamental to comprehending motion and has wide-ranging applications across various scientific and engineering disciplines. From simple uniform acceleration to complex, changing acceleration profiles, the slope of the velocity-time graph remains a crucial tool for analyzing and interpreting motion. By mastering this concept, you gain a deeper understanding of the mechanics that govern the world around us. This knowledge allows you to analyze real-world scenarios, solve problems related to motion, and even contribute to advancements in various fields through innovative applications. Remember to always consider the sign of the slope, which indicates the direction of the acceleration—positive for speeding up, negative for slowing down, and zero for constant velocity. This simple yet powerful concept forms the backbone of kinematics and opens doors to a more profound understanding of motion in all its forms.
Latest Posts
Latest Posts
-
What Is 1 Billion X 1 Trillion
May 09, 2025
-
Vinegar Is An Acid Or Base
May 09, 2025
-
What Is 3 Out Of 4 As A Percentage
May 09, 2025
-
Why Is The Chromosome Number Reduced By Half During Meiosis
May 09, 2025
-
How To Find Particular Solution Differential Equations
May 09, 2025
Related Post
Thank you for visiting our website which covers about What Does The Slope Of The Velocity Time Graph Represent . We hope the information provided has been useful to you. Feel free to contact us if you have any questions or need further assistance. See you next time and don't miss to bookmark.