Difference Between Emission Spectrum And Absorption Spectrum
Juapaving
Mar 17, 2025 · 6 min read
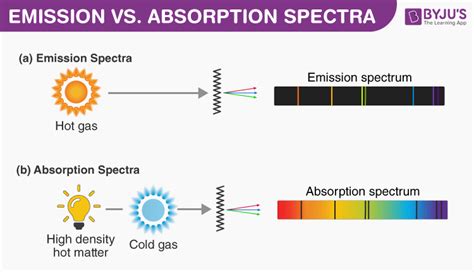
Table of Contents
Delving into the Differences: Emission vs. Absorption Spectra
Understanding the fundamental differences between emission and absorption spectra is crucial in various scientific fields, from astronomy to chemistry. Both are powerful tools for identifying the composition of materials, but their underlying principles and resulting patterns differ significantly. This comprehensive guide will explore these differences in detail, clarifying their applications and highlighting key distinctions.
What is an Emission Spectrum?
An emission spectrum is a unique fingerprint of an element or compound, revealing the specific wavelengths of light it emits when its atoms are excited. This excitation can be achieved through various methods, including heating the substance to a high temperature, passing an electric current through it, or bombarding it with high-energy particles. When excited, electrons jump to higher energy levels. As these electrons return to their ground state (lower energy levels), they release energy in the form of photons – packets of light. Each photon has a specific energy, corresponding to a specific wavelength of light. The wavelengths of these emitted photons constitute the emission spectrum.
How Emission Spectra are Formed: A Closer Look
The process of emission spectrum formation involves several key steps:
-
Excitation: Atoms are energized, causing electrons to jump to higher energy levels (excited states). This energy input can come from heat, electricity, or other forms of radiation.
-
Instability: Excited states are inherently unstable. Electrons in these higher energy levels tend to return to their lower energy ground states.
-
Photon Emission: The transition from a higher energy level to a lower energy level releases energy in the form of a photon. The energy of the photon is directly proportional to the difference in energy between the two levels. This means that different energy level transitions will emit photons of different energies, and therefore, different wavelengths.
-
Spectrum Creation: The collection of all the wavelengths emitted by the excited atoms forms the emission spectrum. This spectrum is typically displayed as a graph showing intensity (brightness) versus wavelength. Bright lines represent the wavelengths of light emitted strongly.
Types of Emission Spectra
There are two main types of emission spectra:
-
Line Emission Spectrum: This is characteristic of elements in the gaseous state. It consists of a series of discrete, bright lines at specific wavelengths, each corresponding to a specific energy transition within the atom. This is due to the quantized energy levels in atoms. The specific wavelengths of these lines are unique to each element, making line spectra extremely useful for elemental identification.
-
Continuous Emission Spectrum: This spectrum exhibits a continuous range of wavelengths, without any distinct lines. It is emitted by heated solids, liquids, or dense gases. This type of spectrum is not as useful for element identification as line emission spectra.
What is an Absorption Spectrum?
An absorption spectrum, in contrast to an emission spectrum, shows the wavelengths of light absorbed by a substance. When light passes through a substance, some wavelengths may be absorbed by its atoms or molecules, causing electrons to transition to higher energy levels. The absorbed wavelengths are absent in the transmitted light, creating dark lines (or bands) in the spectrum. The pattern of these dark lines or bands is unique to the substance, acting like a spectral fingerprint, similar to an emission spectrum.
Understanding Absorption Spectrum Formation
The formation of an absorption spectrum follows these steps:
-
Light Source: A continuous source of light (containing all wavelengths) is passed through the sample.
-
Absorption: Atoms or molecules in the sample absorb specific wavelengths of light, corresponding to the energy differences between their energy levels. Electrons are promoted to higher energy states.
-
Transmission: The remaining light, lacking the absorbed wavelengths, passes through the sample.
-
Spectrum Display: The transmitted light is analyzed using a spectrometer, revealing the spectrum with dark lines or bands at the absorbed wavelengths.
Types of Absorption Spectra
Like emission spectra, absorption spectra can also be categorized:
-
Line Absorption Spectrum: This is obtained when light passes through a gas. It presents as a continuous spectrum interrupted by dark lines, each representing a wavelength absorbed by the atoms in the gas. The location of these dark lines corresponds to the wavelengths emitted in the element's emission spectrum.
-
Band Absorption Spectrum: This occurs when light passes through a liquid or solid and presents as broad dark bands. The bands result from the complex interactions of molecules within these phases.
Key Differences Between Emission and Absorption Spectra
The following table summarizes the key differences between emission and absorption spectra:
| Feature | Emission Spectrum | Absorption Spectrum |
|---|---|---|
| Process | Atoms emit light as electrons return to ground state | Atoms absorb light, causing electrons to jump to higher energy levels |
| Appearance | Bright lines or continuous bands of light | Dark lines or bands on a continuous background |
| Information | Reveals wavelengths of light emitted by a substance | Reveals wavelengths of light absorbed by a substance |
| Excitation | Requires an energy source to excite atoms | Requires a light source to illuminate the sample |
| Application | Identifying elements in stars, identifying unknown substances | Identifying elements, studying molecular structure |
| Relationship | Lines in absorption spectrum correspond to lines in emission spectrum for the same element | Lines in absorption and emission spectrum (for same element) are located at the same wavelength |
Applications of Emission and Absorption Spectroscopy
Both emission and absorption spectroscopy have extensive applications across numerous scientific disciplines:
Emission Spectroscopy Applications:
-
Astronomy: Analyzing the light from stars and galaxies to determine their elemental composition and temperature. This helps us understand the composition and evolution of celestial bodies.
-
Chemical Analysis: Identifying unknown substances by analyzing their emission spectra. This is a vital tool in forensic science and environmental monitoring.
-
Material Science: Characterizing materials and analyzing their purity.
Absorption Spectroscopy Applications:
-
Medical Diagnostics: Analyzing blood samples to measure concentrations of various substances. This is a routine process for determining glucose, cholesterol, and other important parameters in blood.
-
Environmental Monitoring: Detecting pollutants in air and water. Specific absorption lines or bands allow for the identification and quantification of pollutants.
-
Chemical Kinetics: Studying reaction rates by monitoring the changes in absorption spectra over time.
-
Remote Sensing: Analyzing the reflection of light from Earth's surface to study vegetation, mineral deposits, and other features.
Spectral Fingerprints and Element Identification
Both emission and absorption spectra provide unique "spectral fingerprints" for elements and compounds. The specific wavelengths absorbed or emitted are characteristic of the element's electronic structure. This allows for precise identification of substances even in complex mixtures. The lines in an absorption spectrum correspond directly to the lines in the emission spectrum of the same element. This fundamental connection is extremely valuable in analytical chemistry and astronomy.
Conclusion: A Powerful Analytical Duo
Emission and absorption spectra represent powerful analytical tools that complement each other. Understanding their underlying principles and differences is essential for interpreting spectroscopic data and leveraging their extensive applications across diverse scientific disciplines. While distinct in their approach, both techniques utilize the unique interaction of light with matter to reveal invaluable information about the composition and properties of substances, making them indispensable in modern scientific analysis. Their widespread use underlines their significance in advancing our understanding of the universe and the world around us.
Latest Posts
Latest Posts
-
Lowest Common Multiple Of 28 And 32
Mar 17, 2025
-
What Are The Factor Pairs Of 30
Mar 17, 2025
-
The Idea Of Spontaneous Generation Postulated That
Mar 17, 2025
-
How Many Sides Are There In A Pentagon
Mar 17, 2025
-
How Are Mixtures Different From Solutions
Mar 17, 2025
Related Post
Thank you for visiting our website which covers about Difference Between Emission Spectrum And Absorption Spectrum . We hope the information provided has been useful to you. Feel free to contact us if you have any questions or need further assistance. See you next time and don't miss to bookmark.
